Start with the records you already have. Claims may tell you how many people have a recorded diagnosis and where they receive care. To compare what happened before and after treatment, you need records that capture the outcome in both periods for the same patients.
Claims, health records and registries are sources of real-world data (RWD). You get real-world evidence (RWE) when you analyse those records to answer a specific question. Ask your data partners what their sources can answer today. That helps you decide where linking sources or reviewing more records could change a decision.
TrialStack is the clinical development system for teams and agents. In this walkthrough, clinical and evidence teams define one question they can take to a data partner. The analysis team can see which people, measurements and time periods the answer depends on.
1. Define one question worth carrying forward
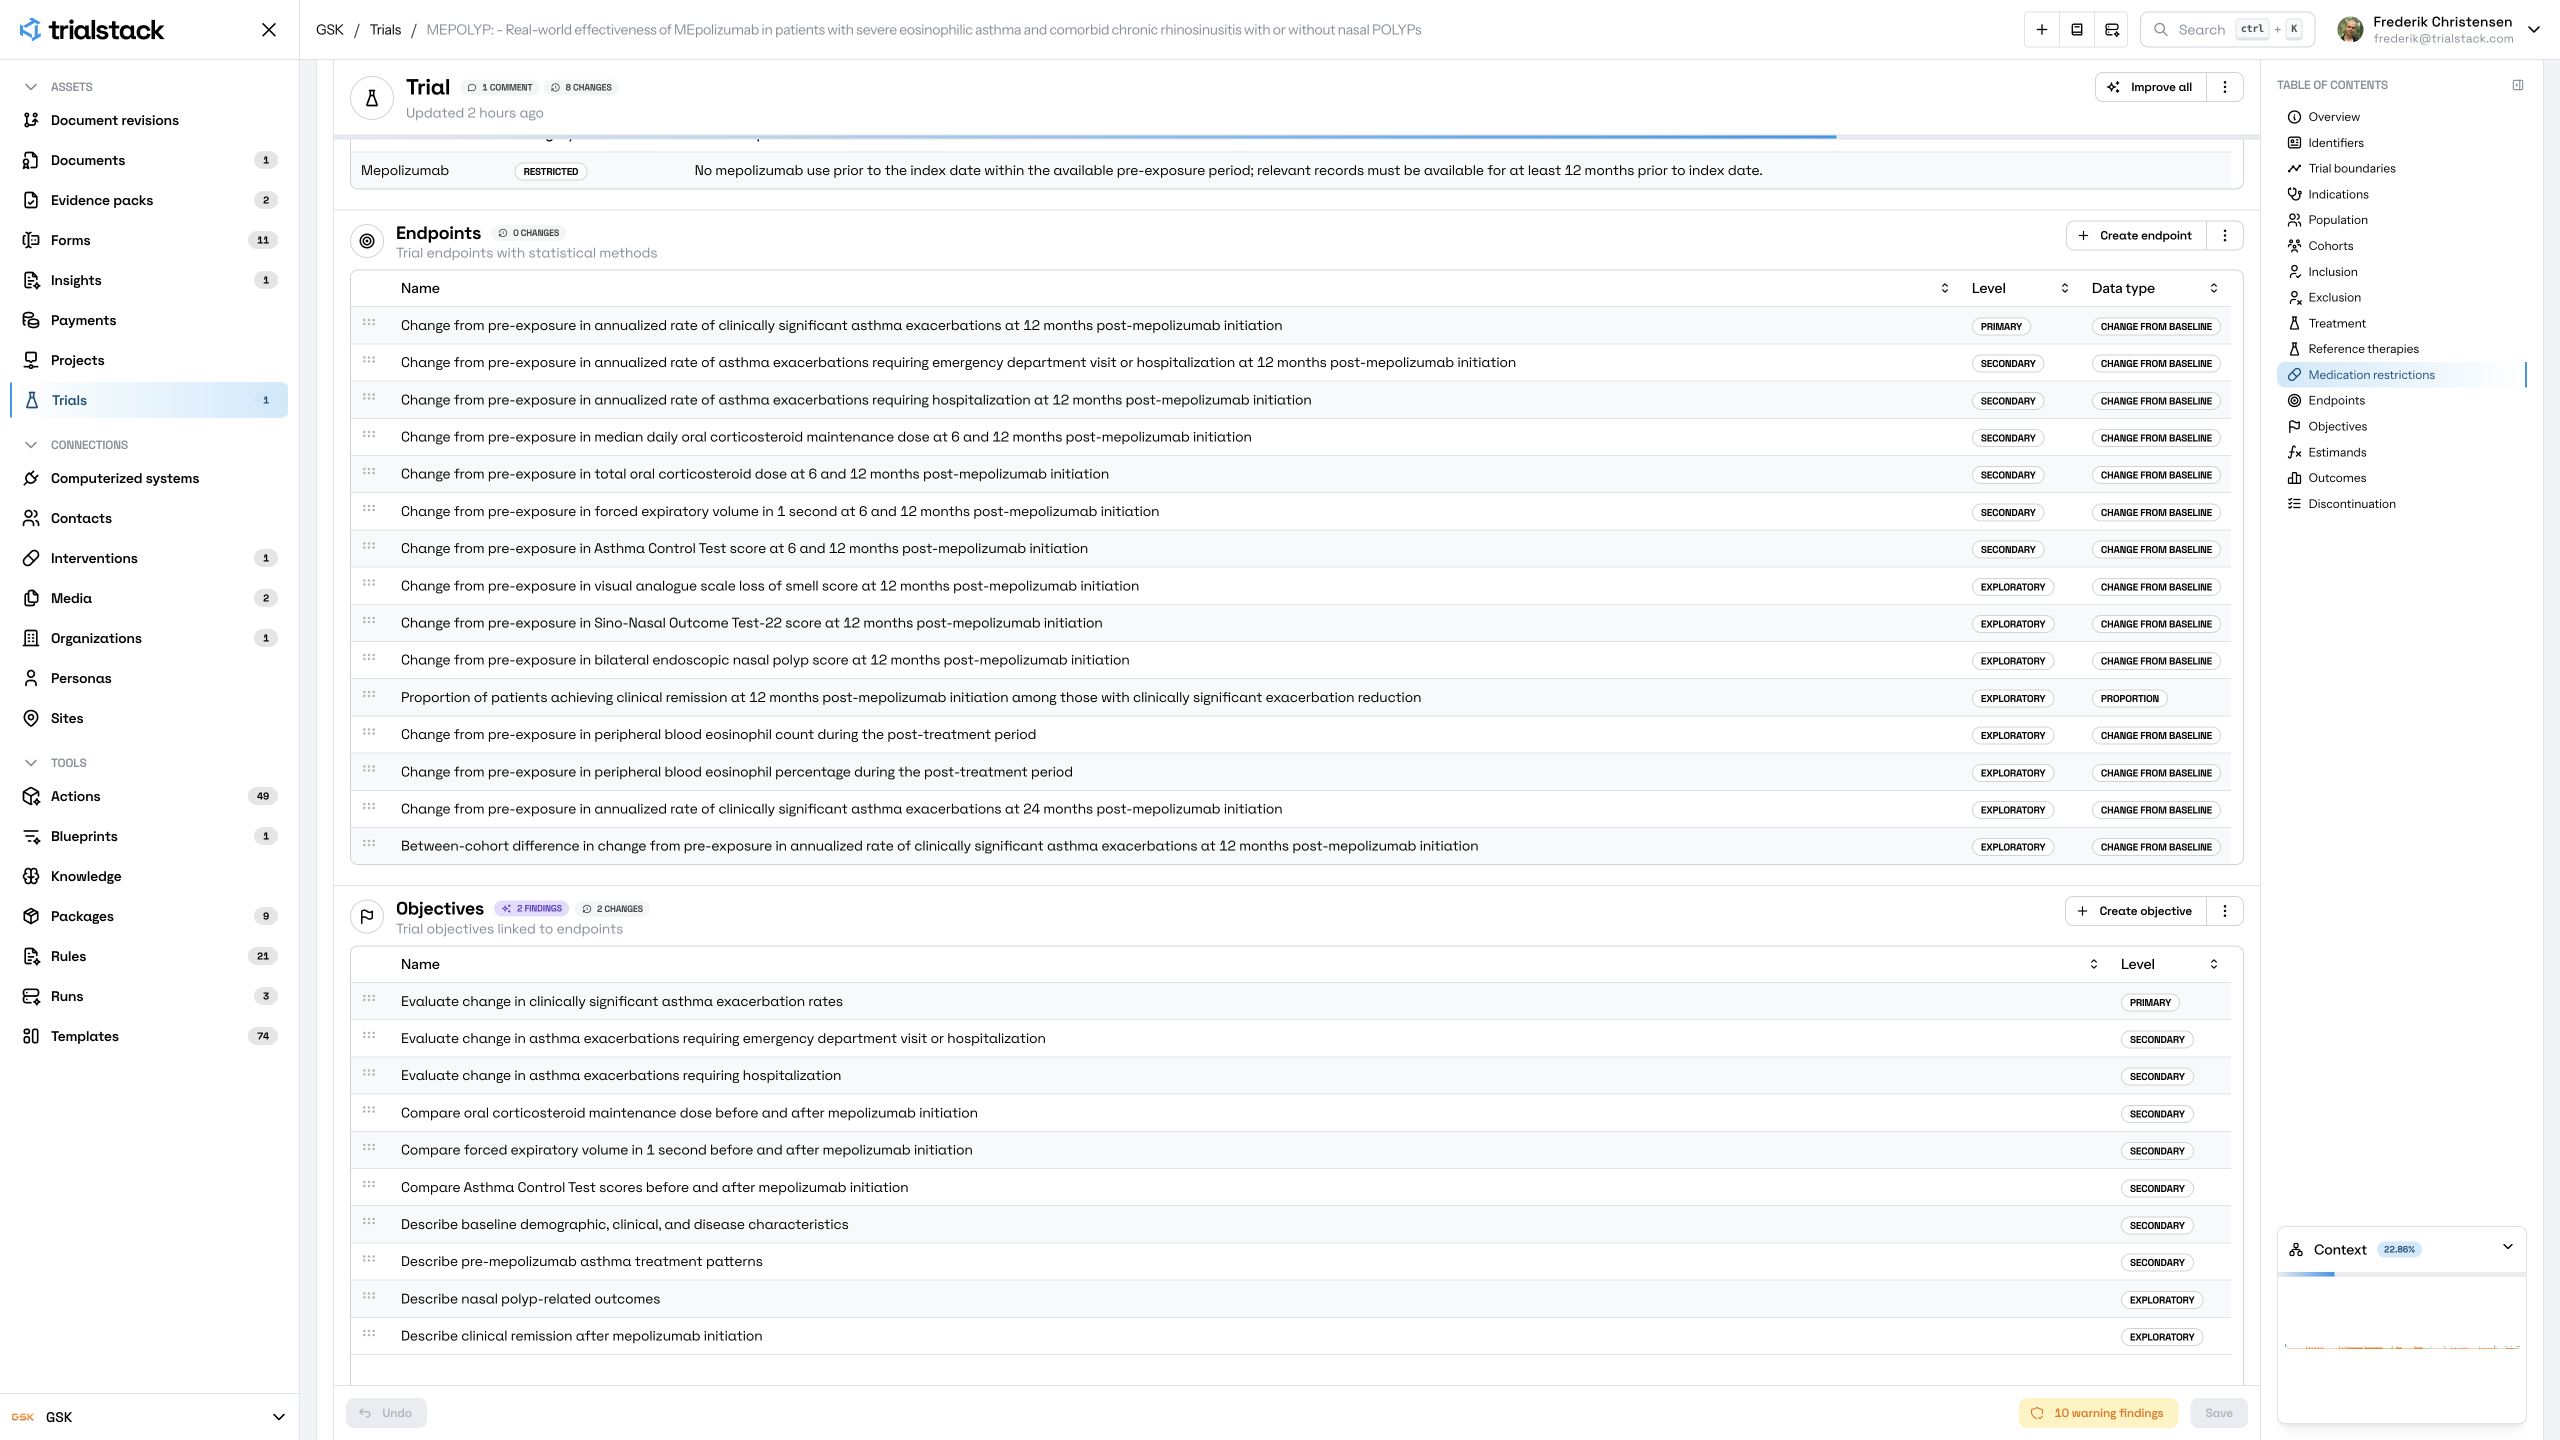
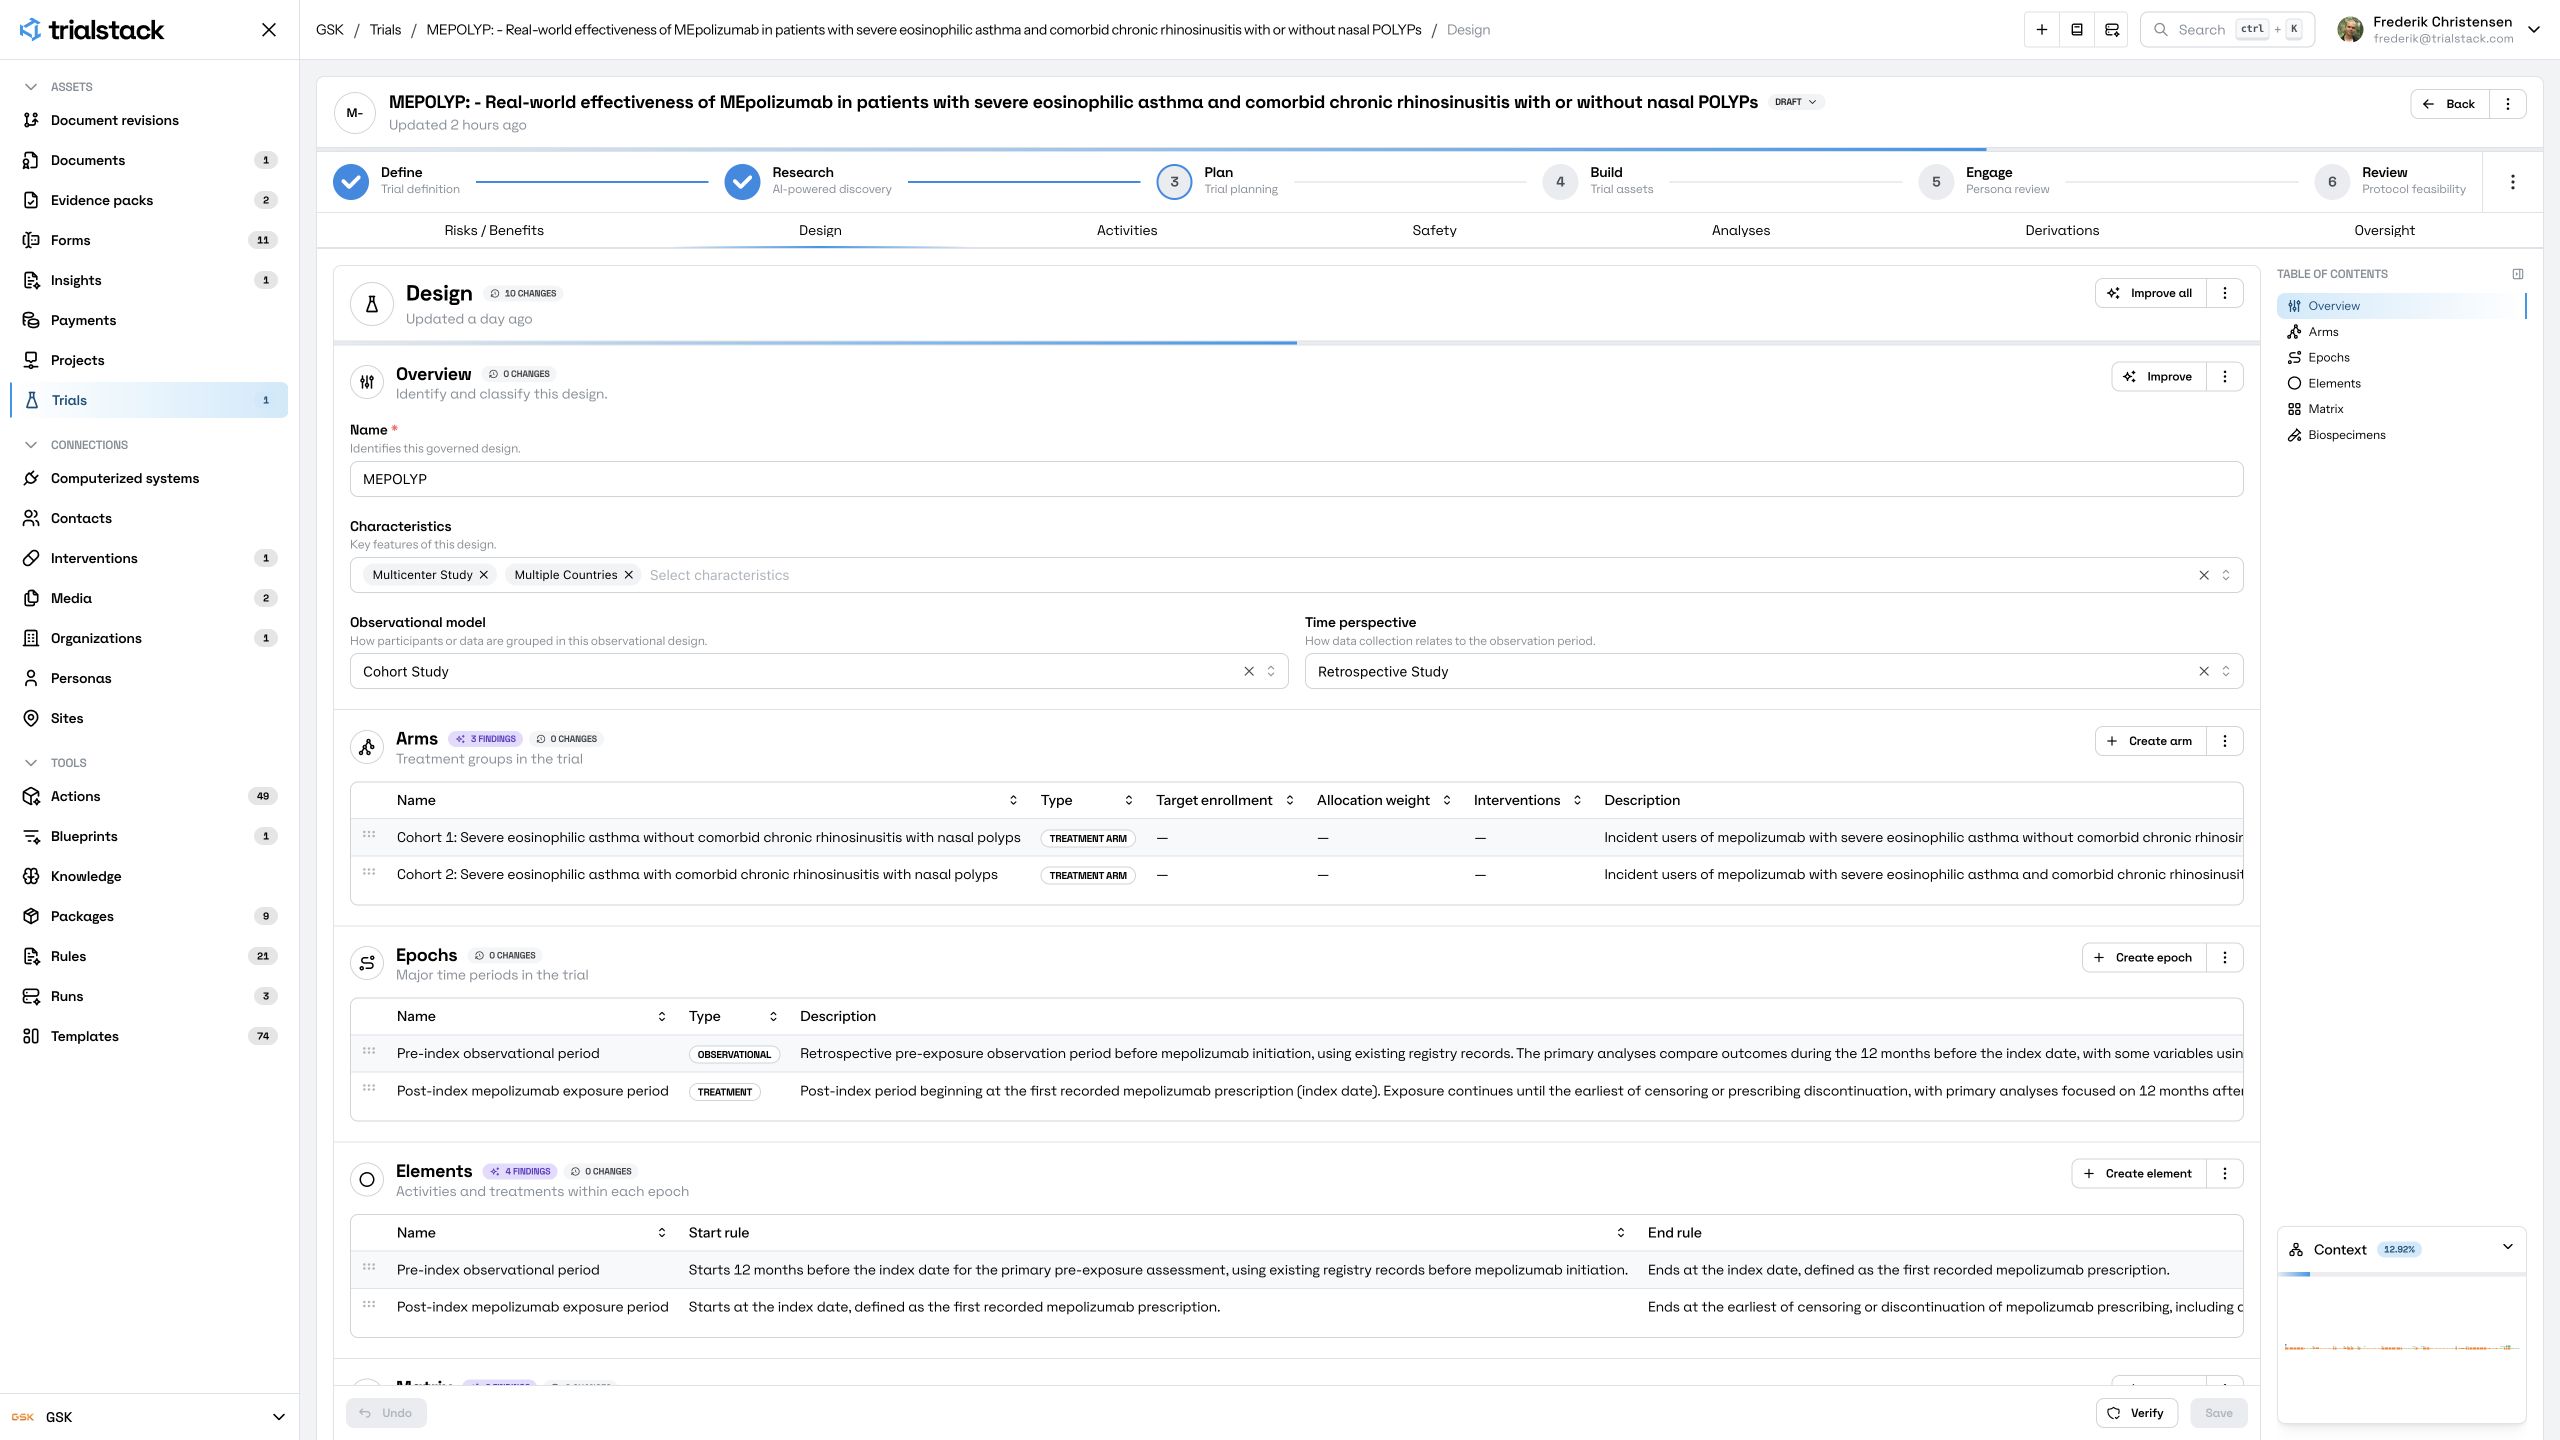
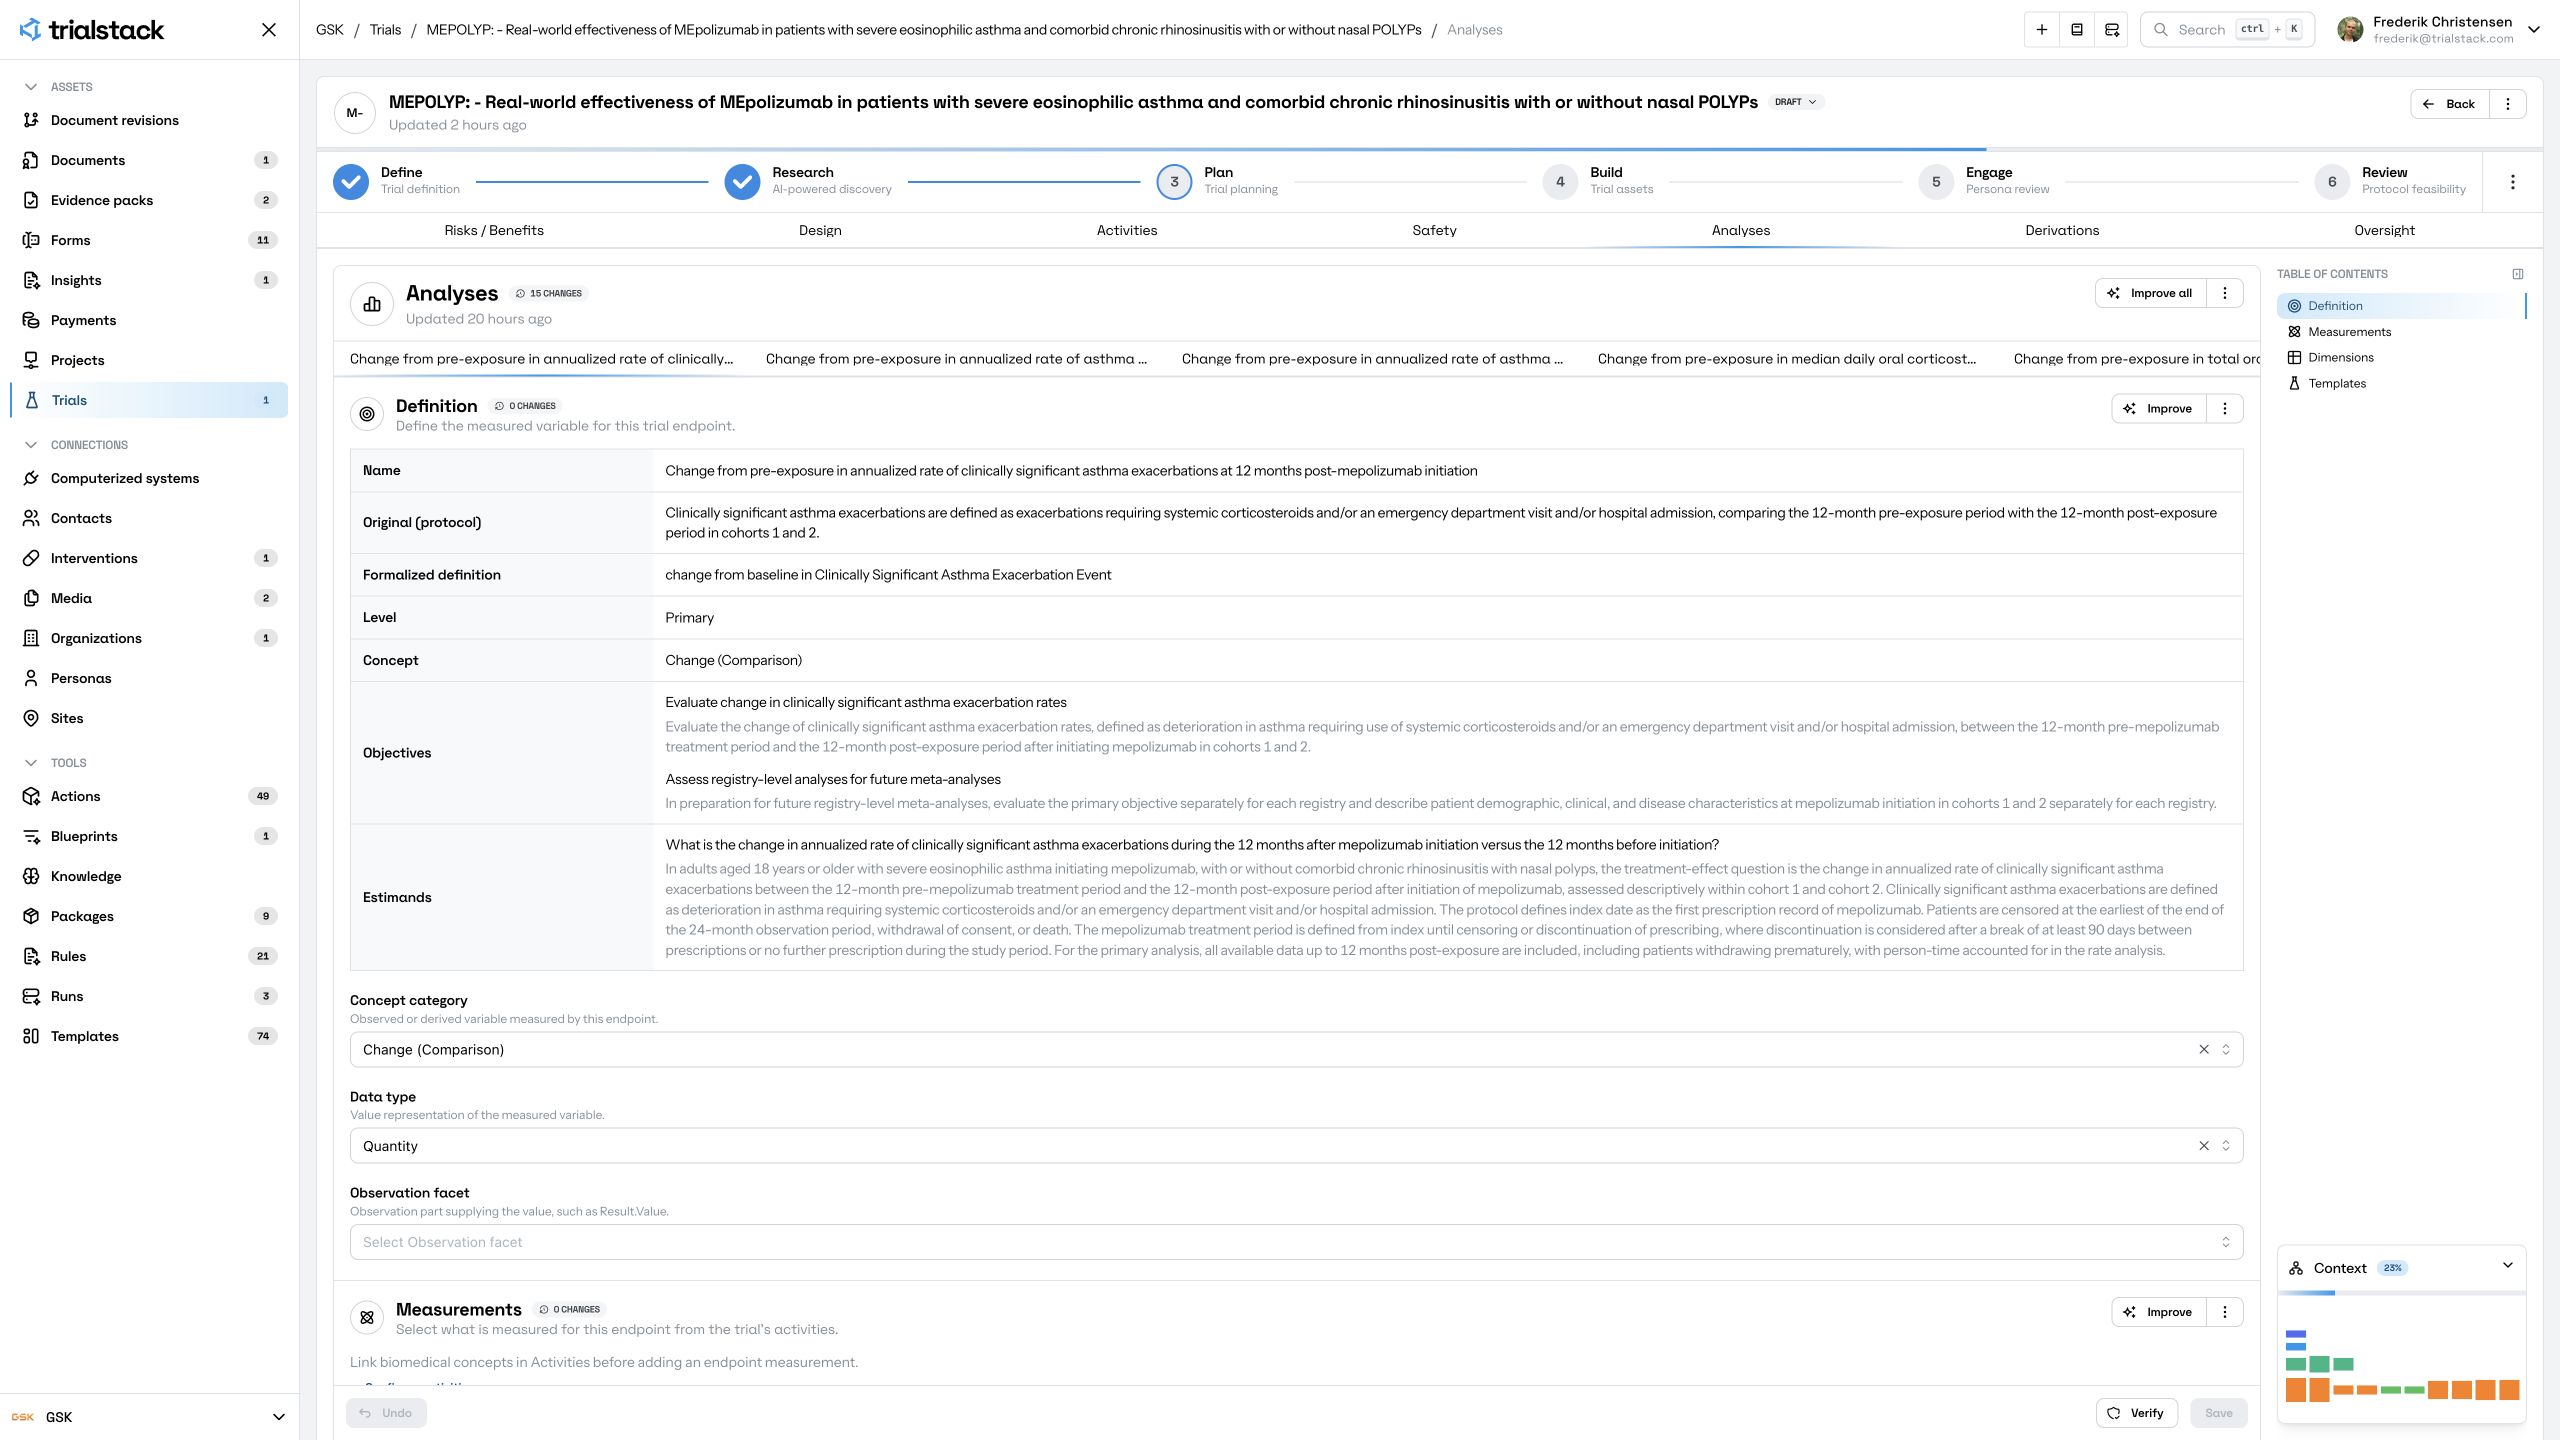
In the MEPOLYP protocol (2023), researchers asked whether asthma flare-ups became more or less frequent in the year after the first recorded mepolizumab prescription. They compared that year with the year before the prescription, separately in each patient group. They counted flare-ups that required systemic corticosteroids, emergency department care or hospital admission.
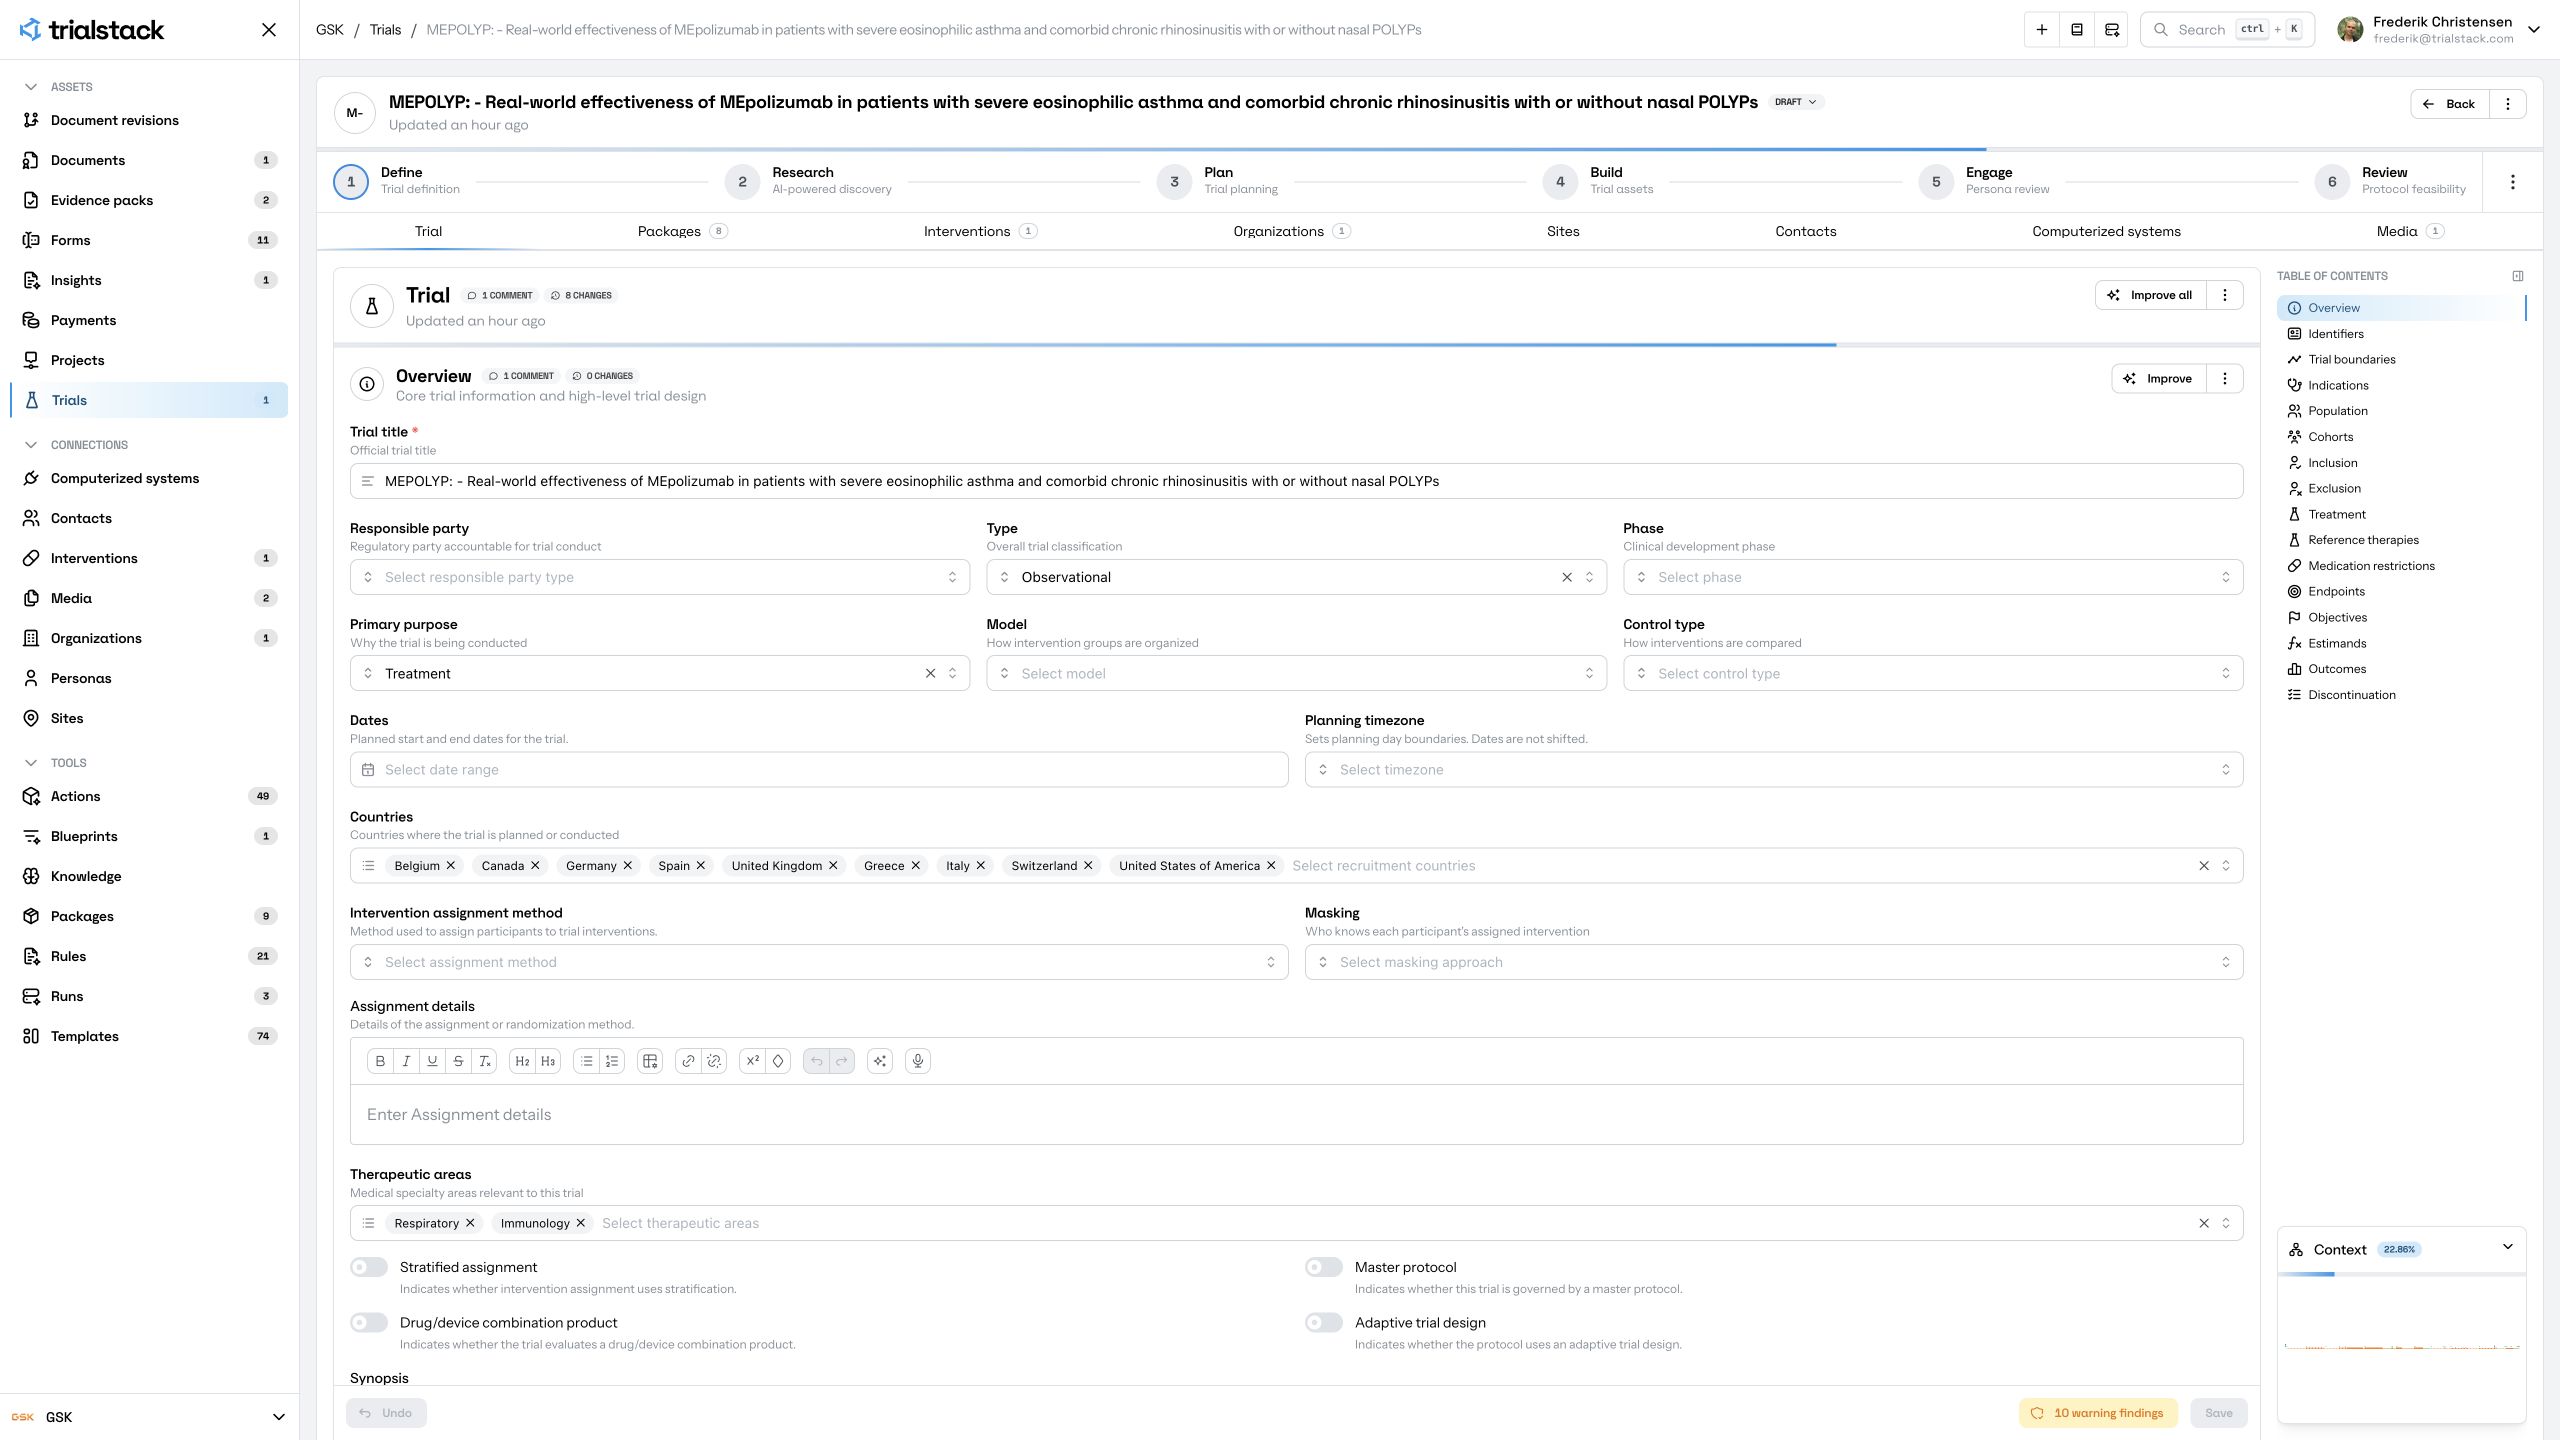
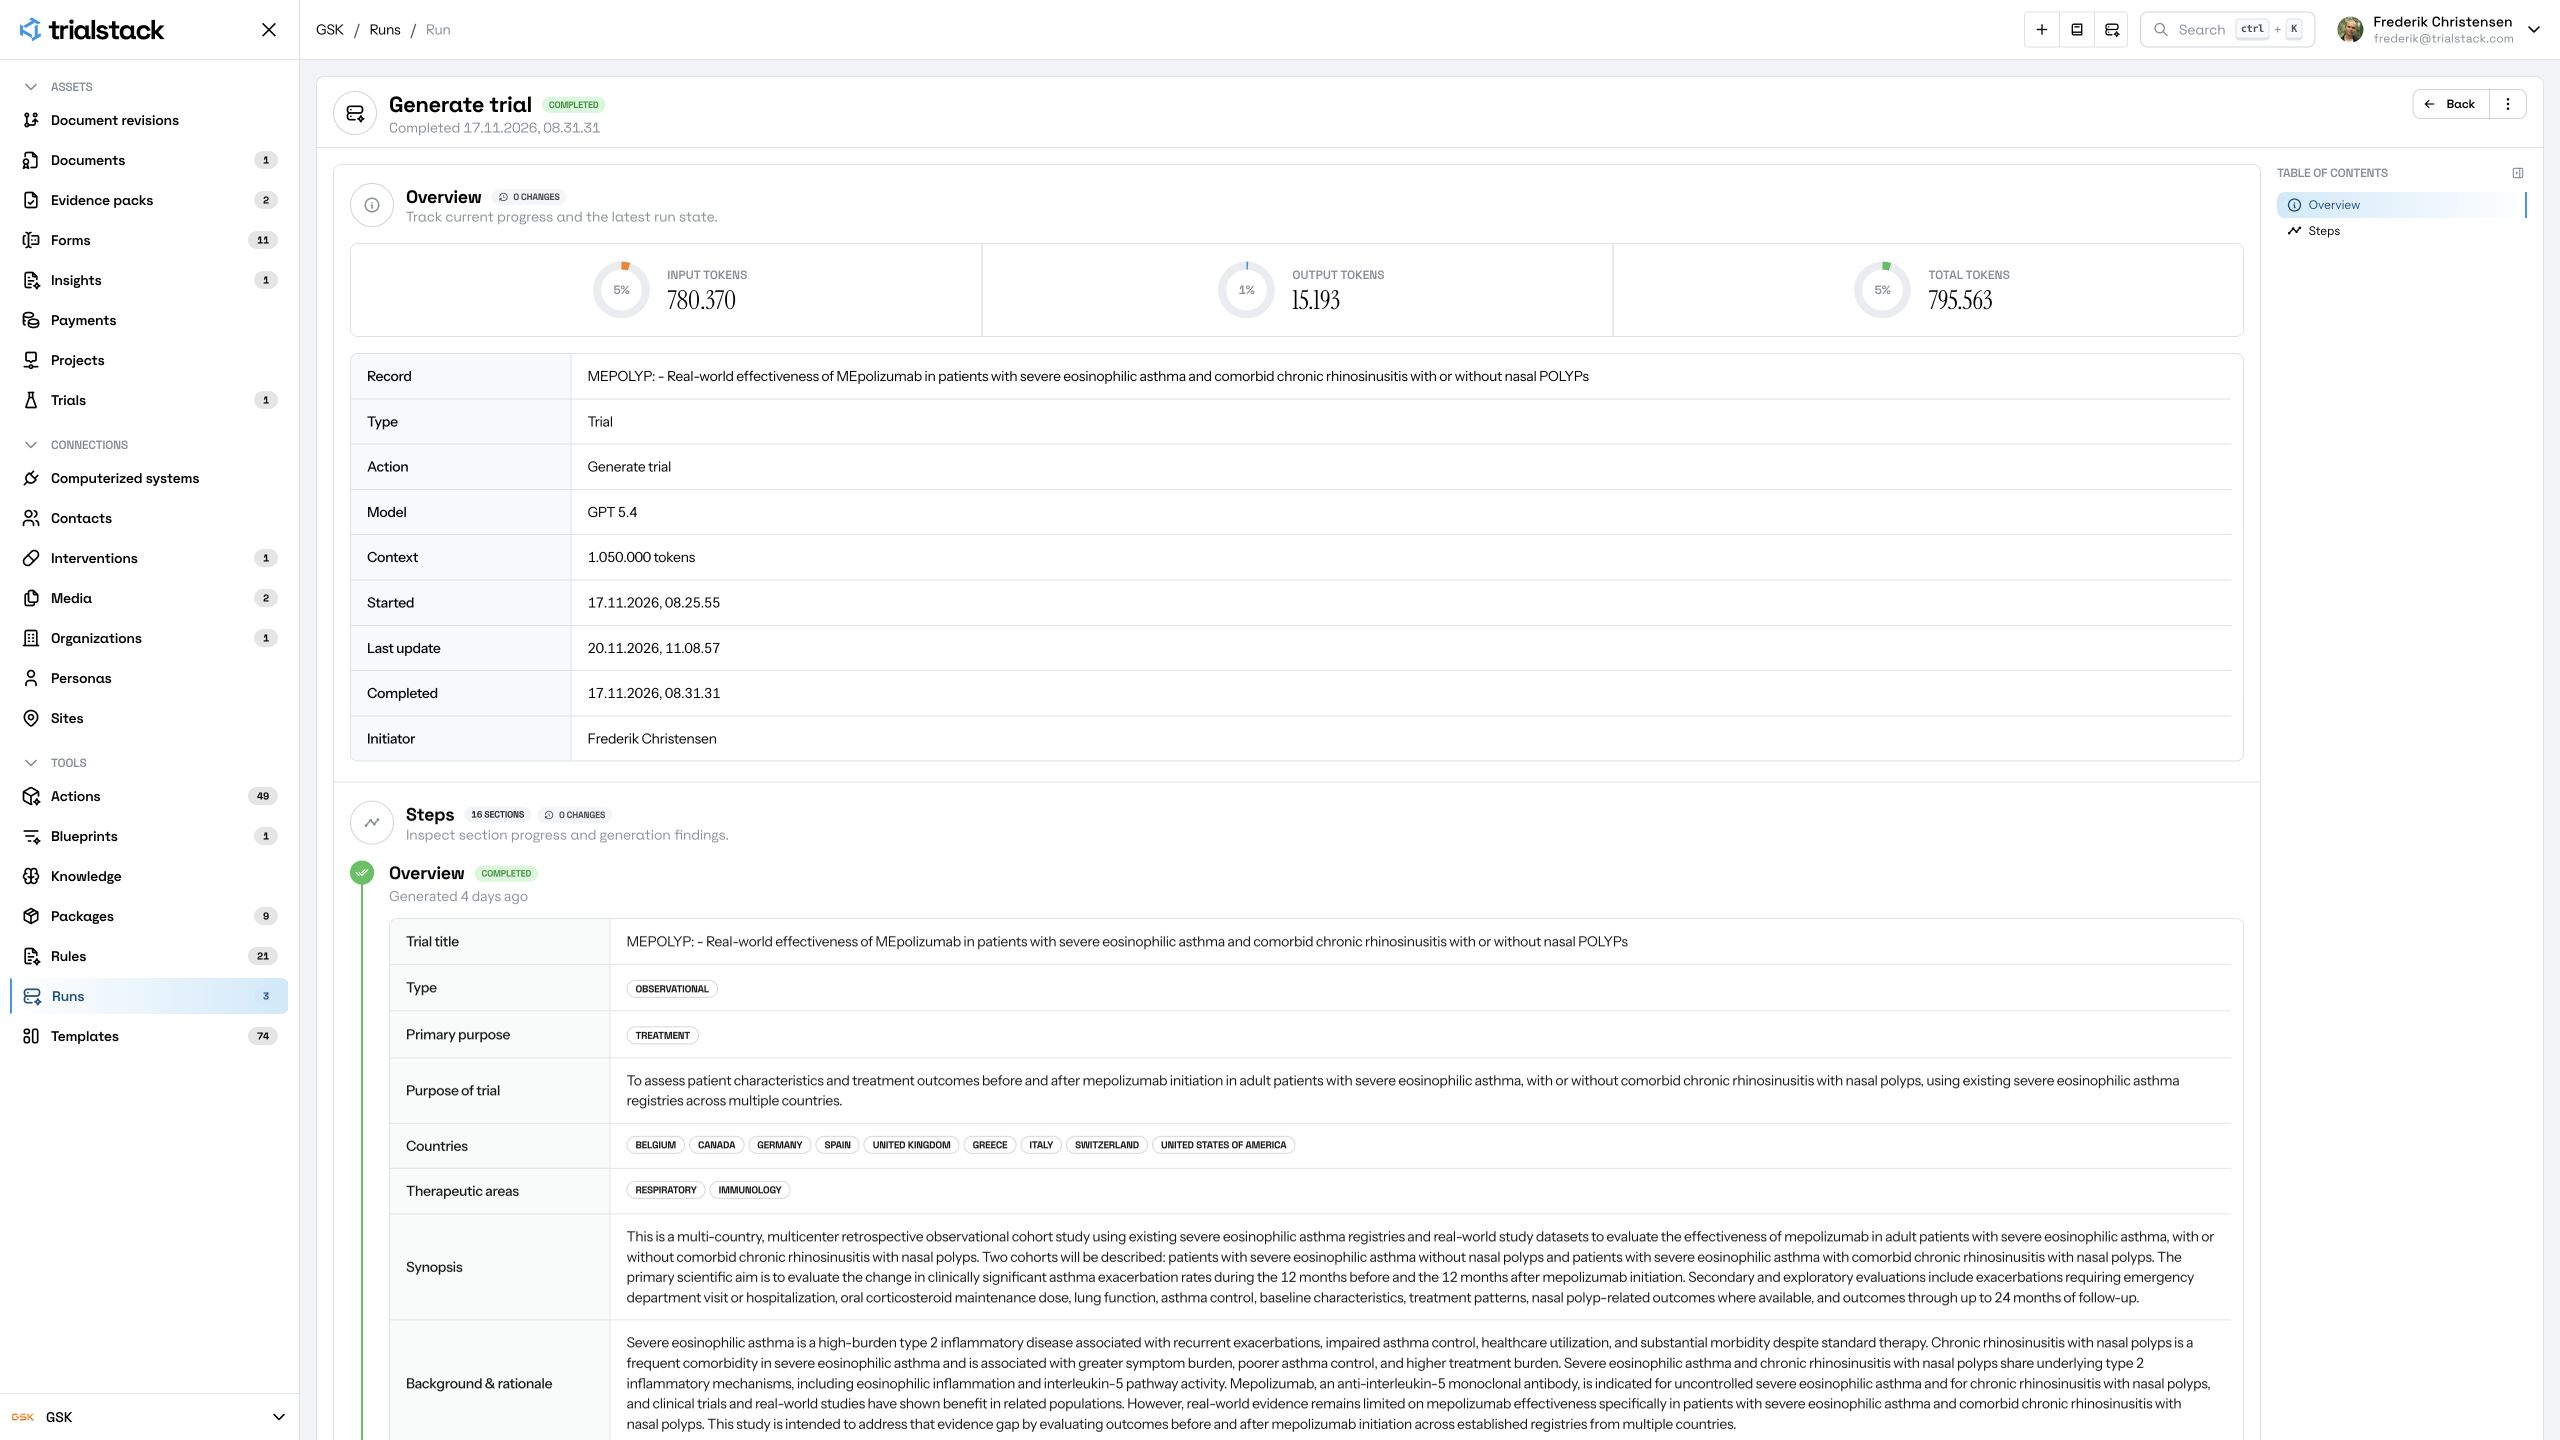
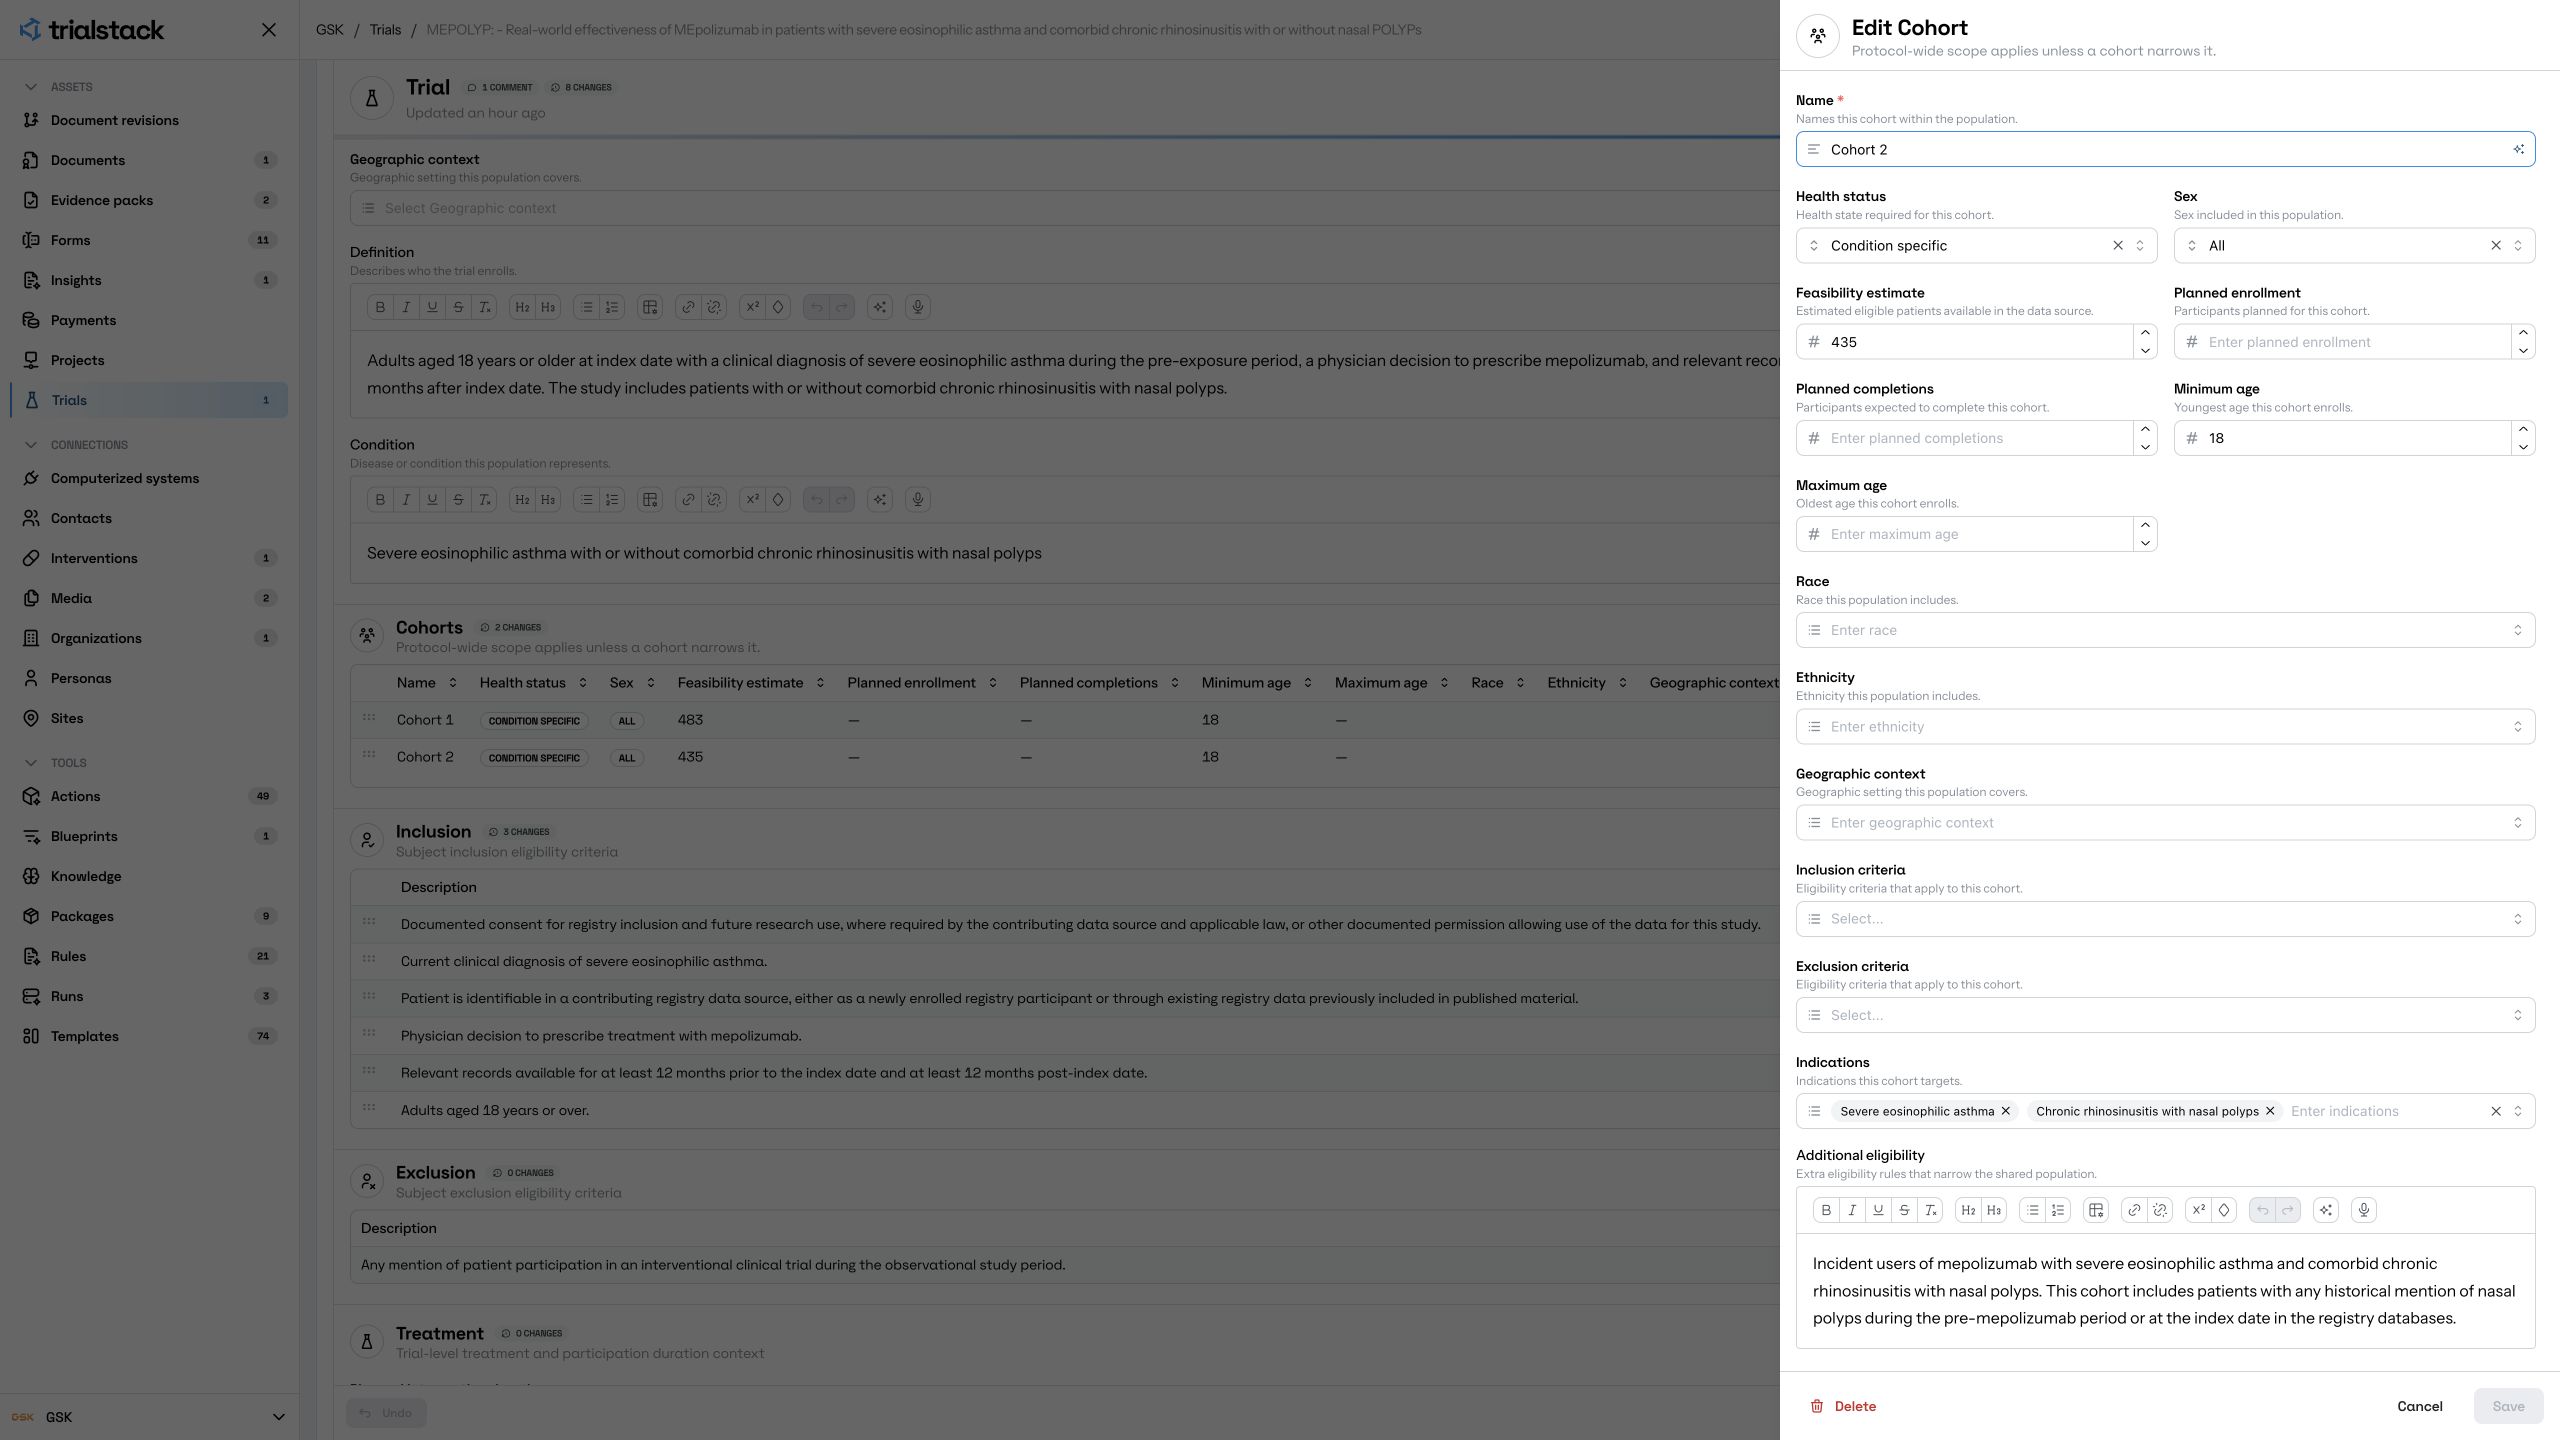
The published analysis (2025) used five existing sources. Three contributed individual records and two provided summary results. The results summary (2024) records 1,037 adults with severe eosinophilic asthma who received mepolizumab. The analysis grouped people by whether their records showed chronic rhinosinusitis with nasal polyps. There were 416 people with a record of the condition and 621 without one. The screenshot shows the earlier estimates of 435 and 483 from the statistical analysis plan (2024). Changes over time may also reflect differences in care or how flare-ups were recorded.
We used the public documents to build an independent demo. TrialStack drafted the patient groups and measures for review. Generating the trial definition took 5 min 36 sec and the design took 5 min 5 sec. Scientific review takes additional time.
2. Make the source prove it can support the endpoint
Could your data partner reliably identify the first prescription, the flare-ups that count and a year of records on either side? Ask how consistently the source captures those details. That helps you see what the existing data can answer and where a second source might help. CDISC’s guidance for observational data starts with a source that has been assessed for its intended use. HL7’s healthcare-to-research mappings can then help teams align the fields they have.
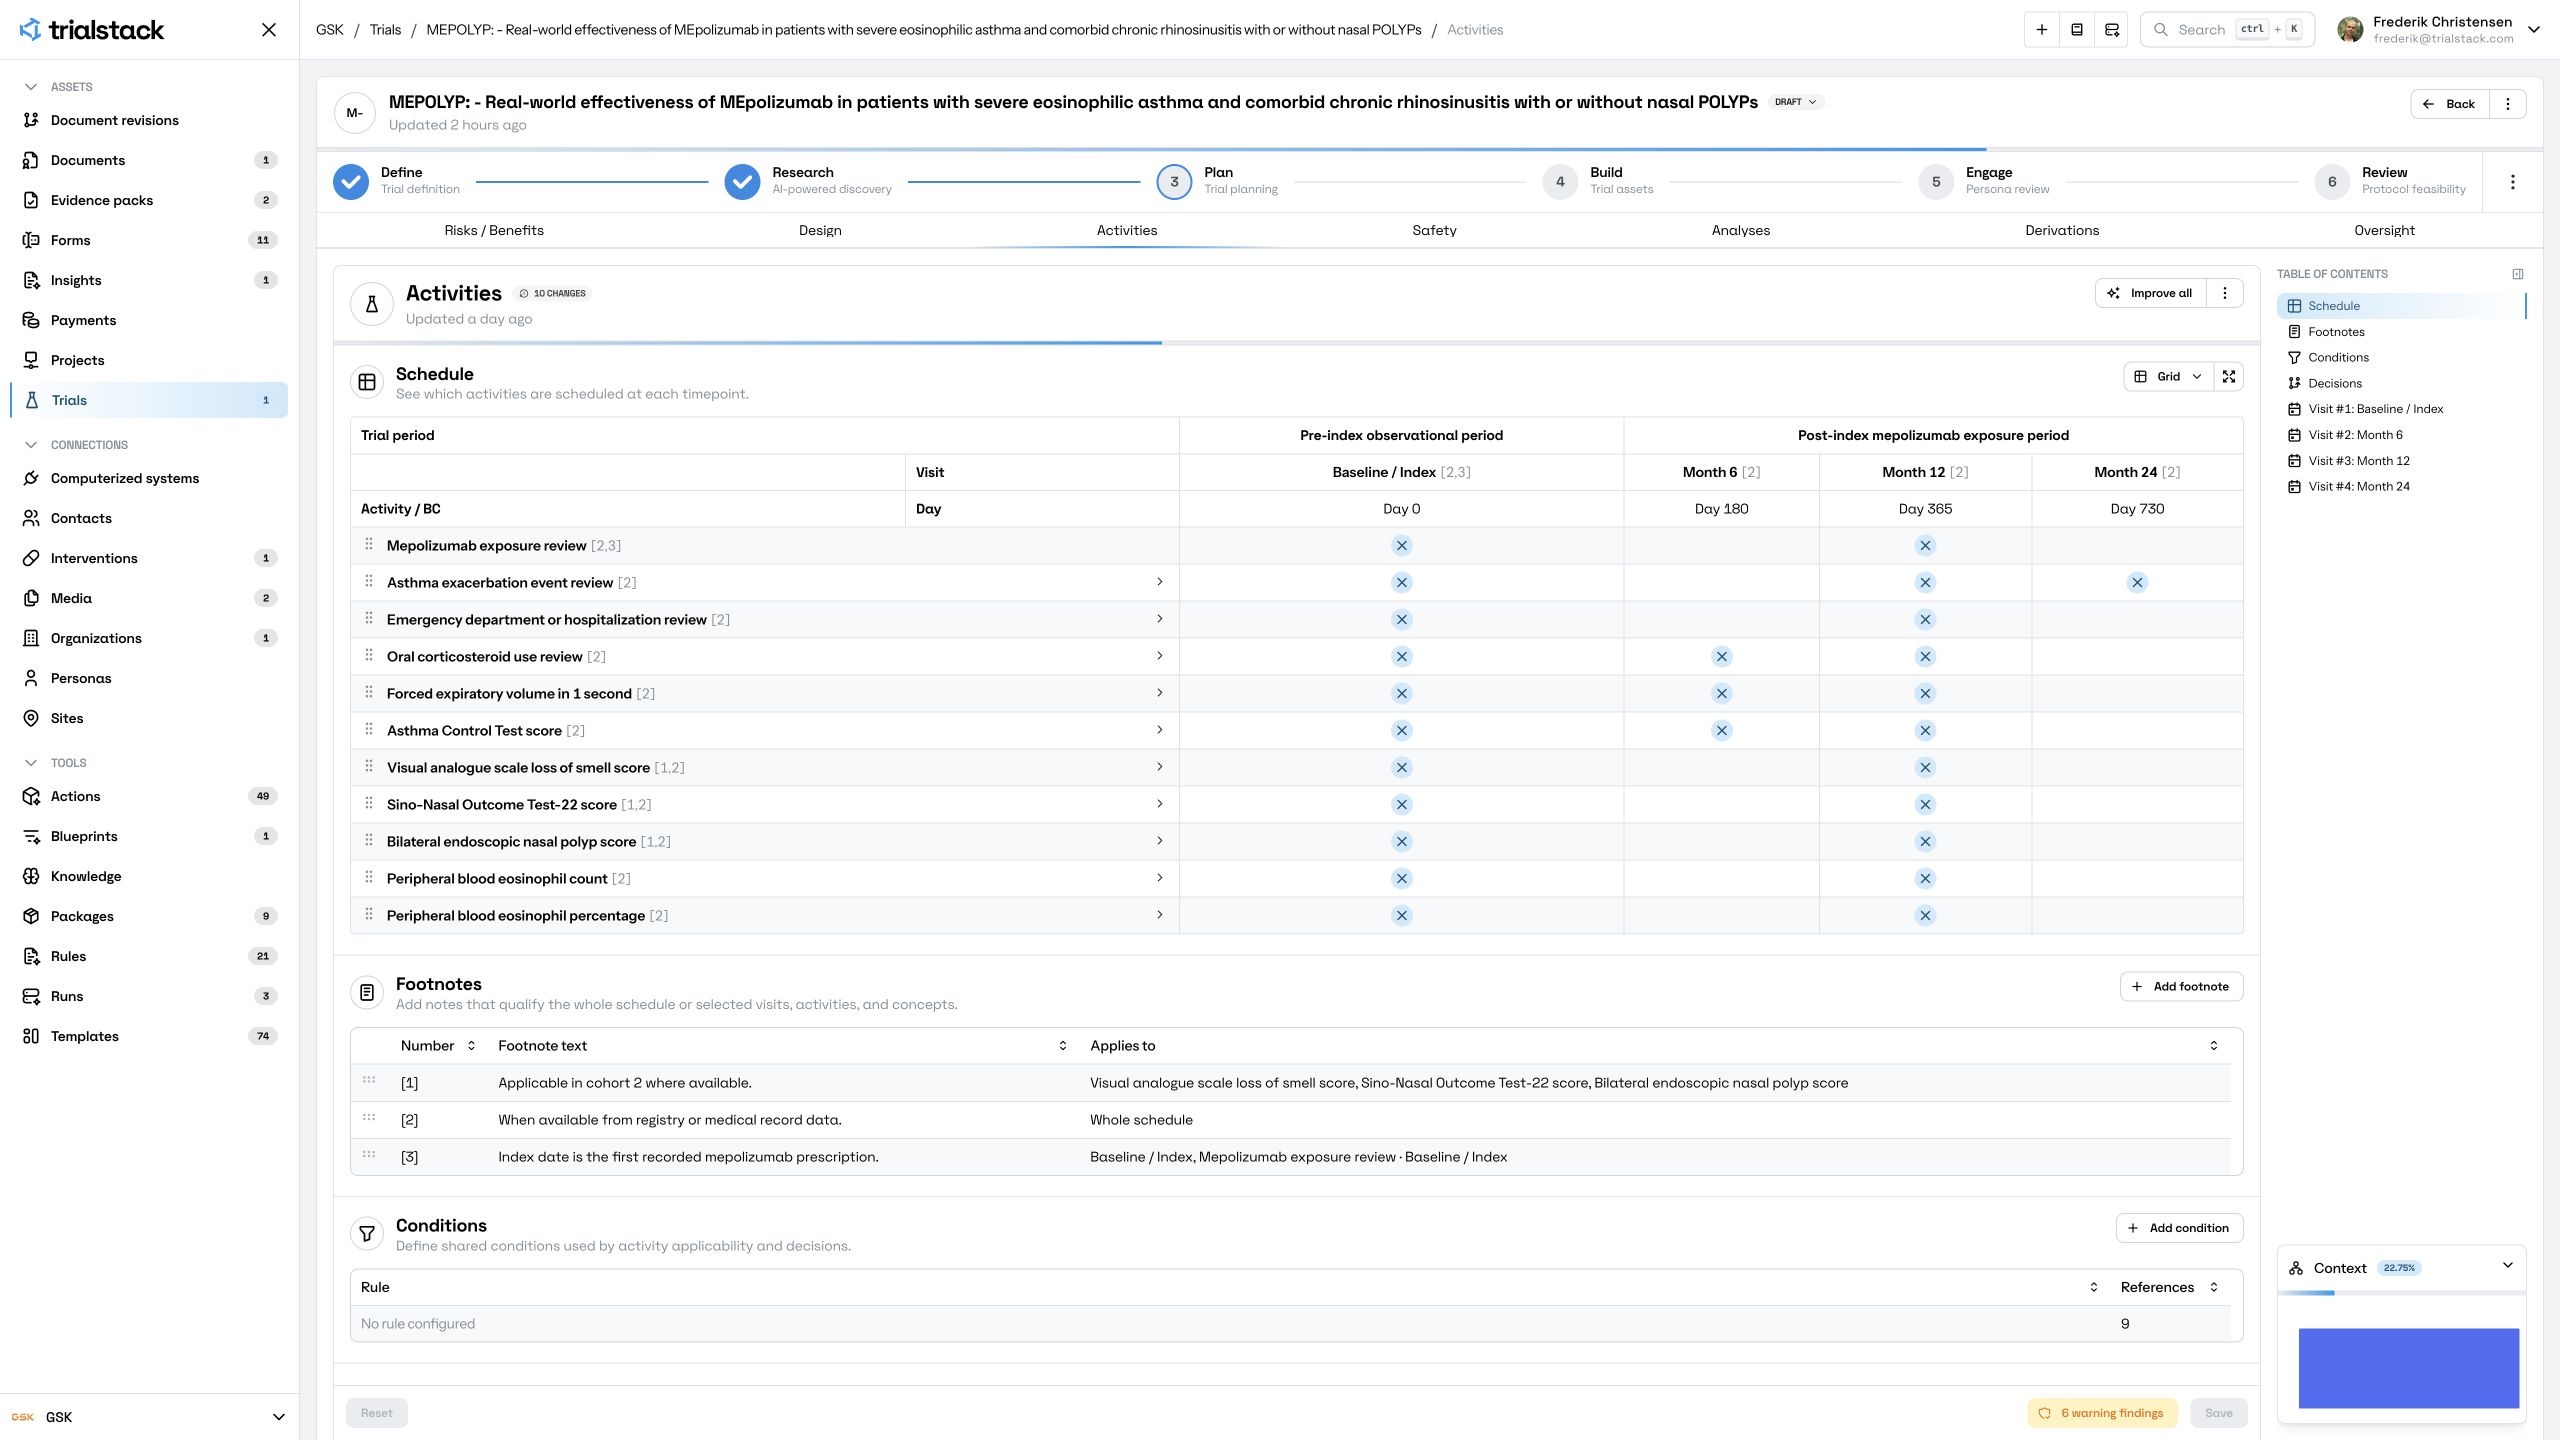
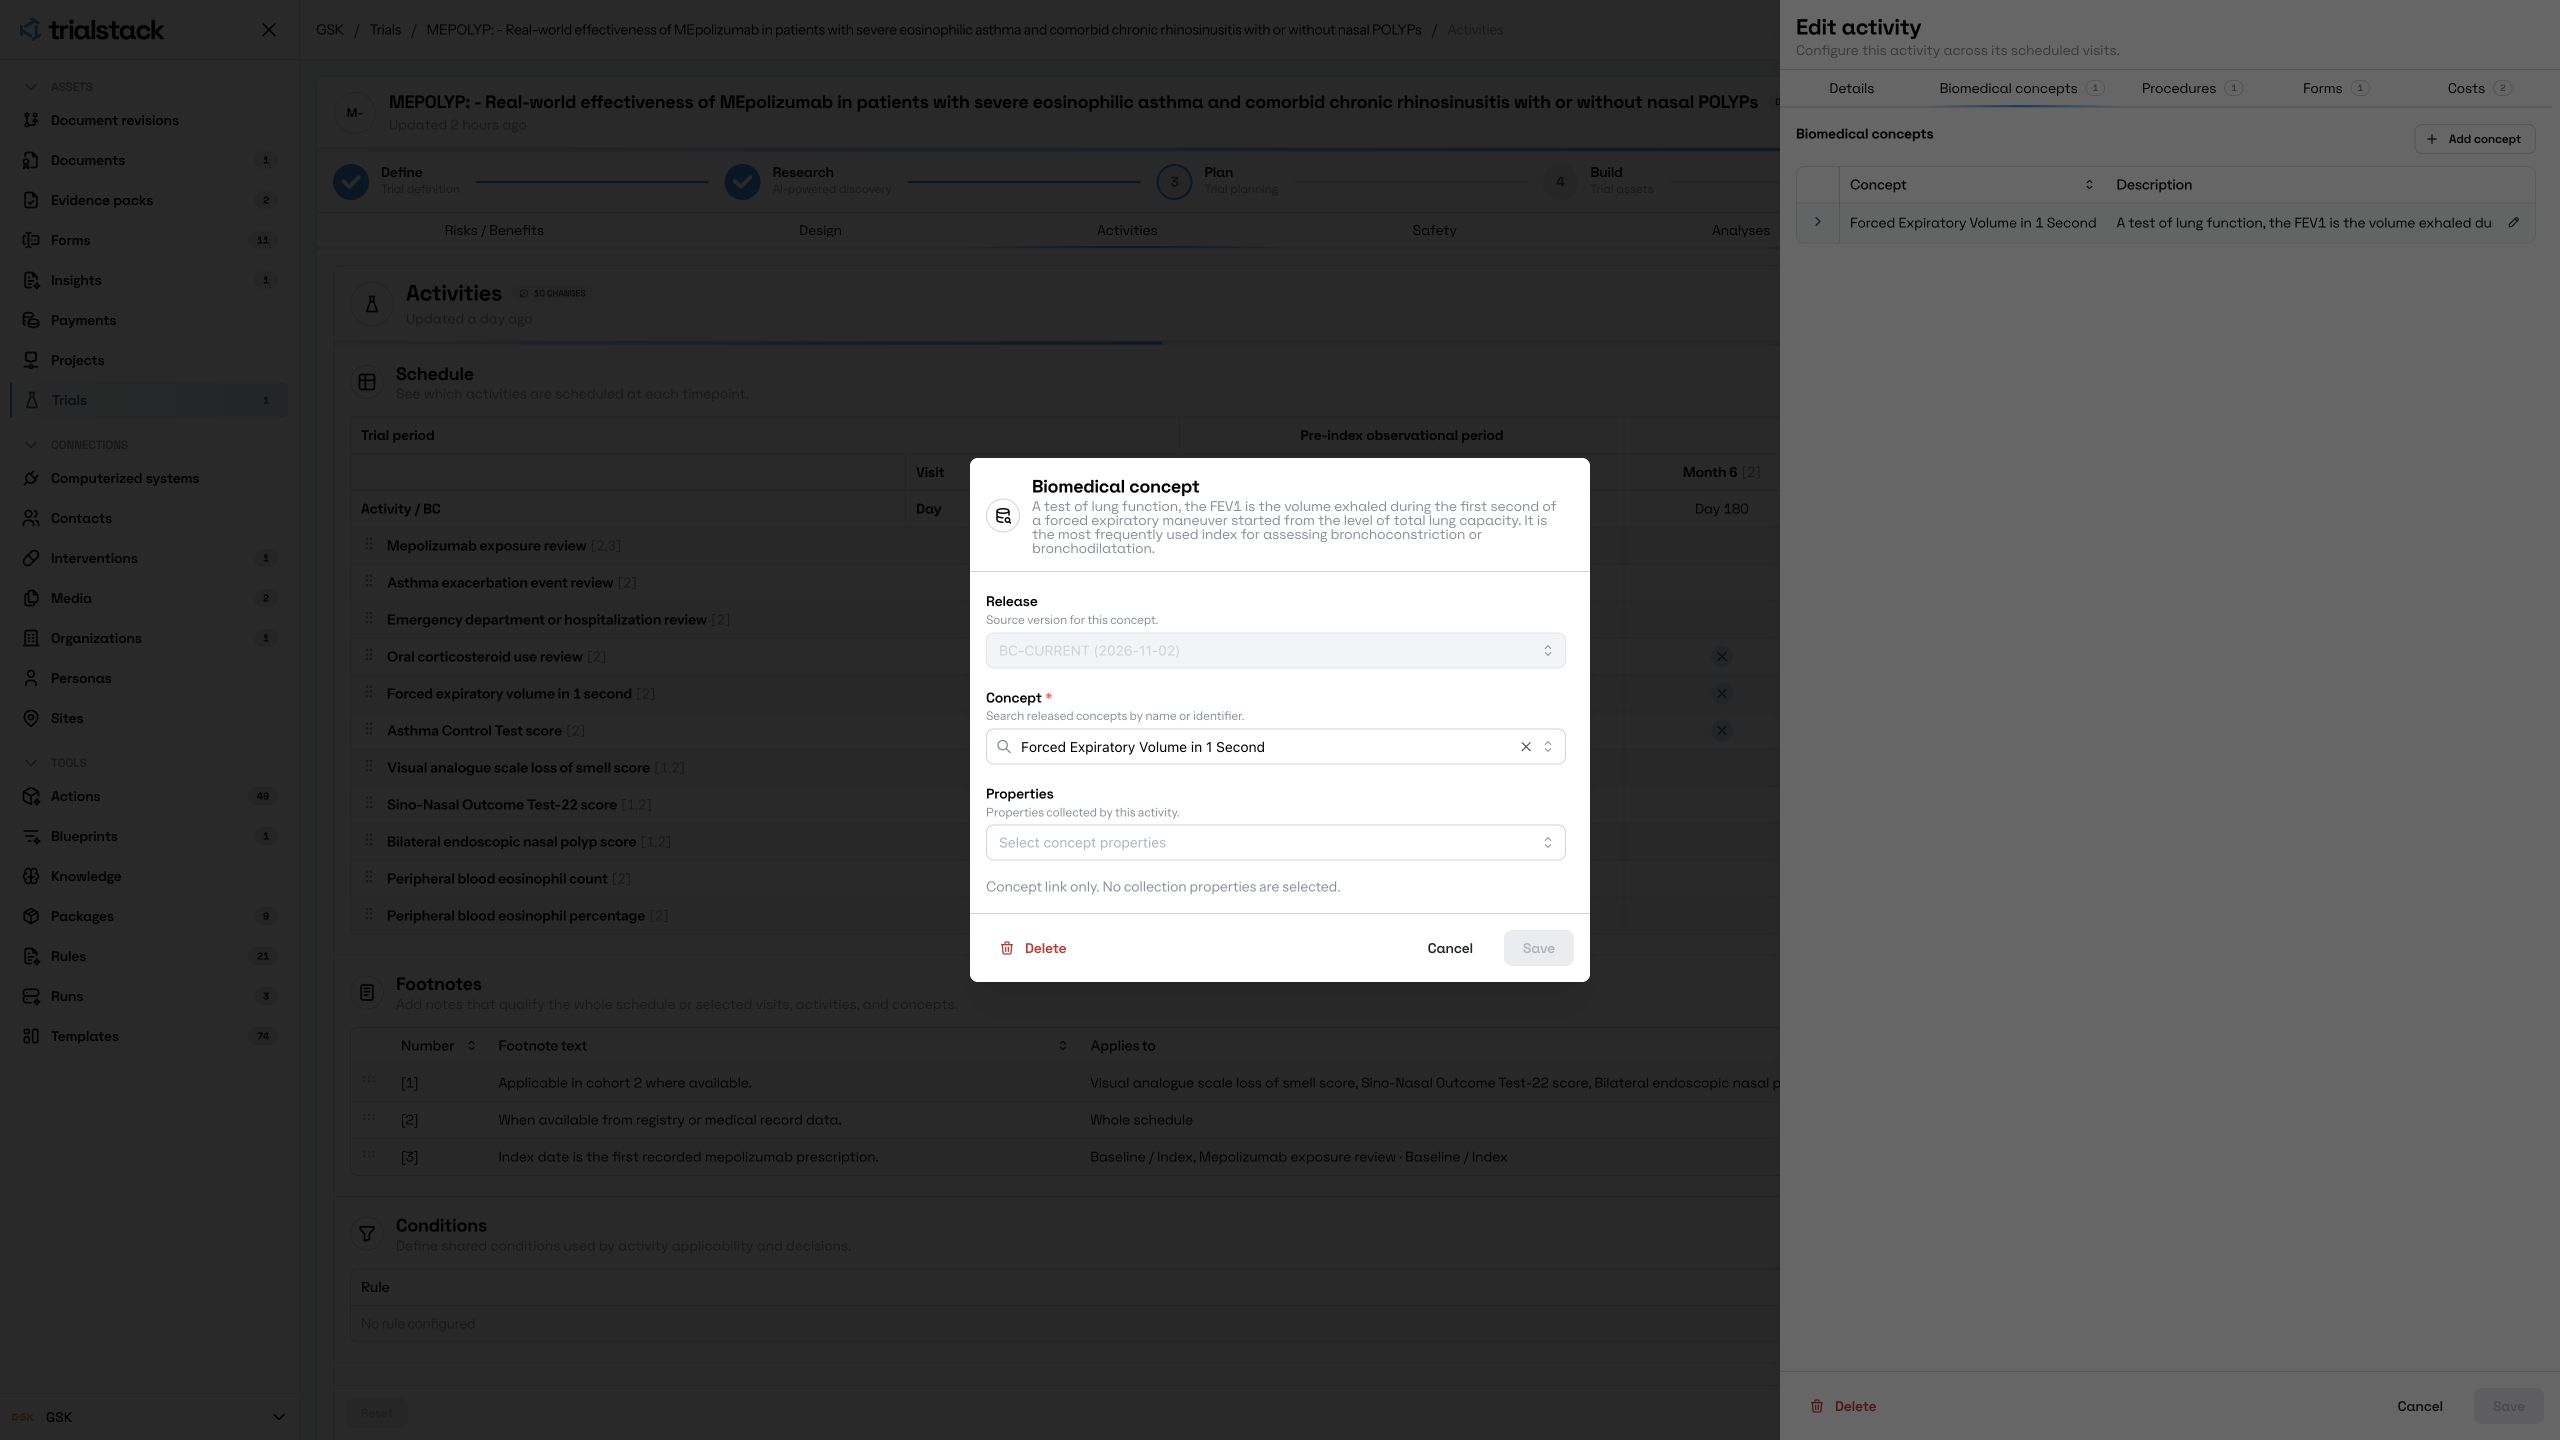
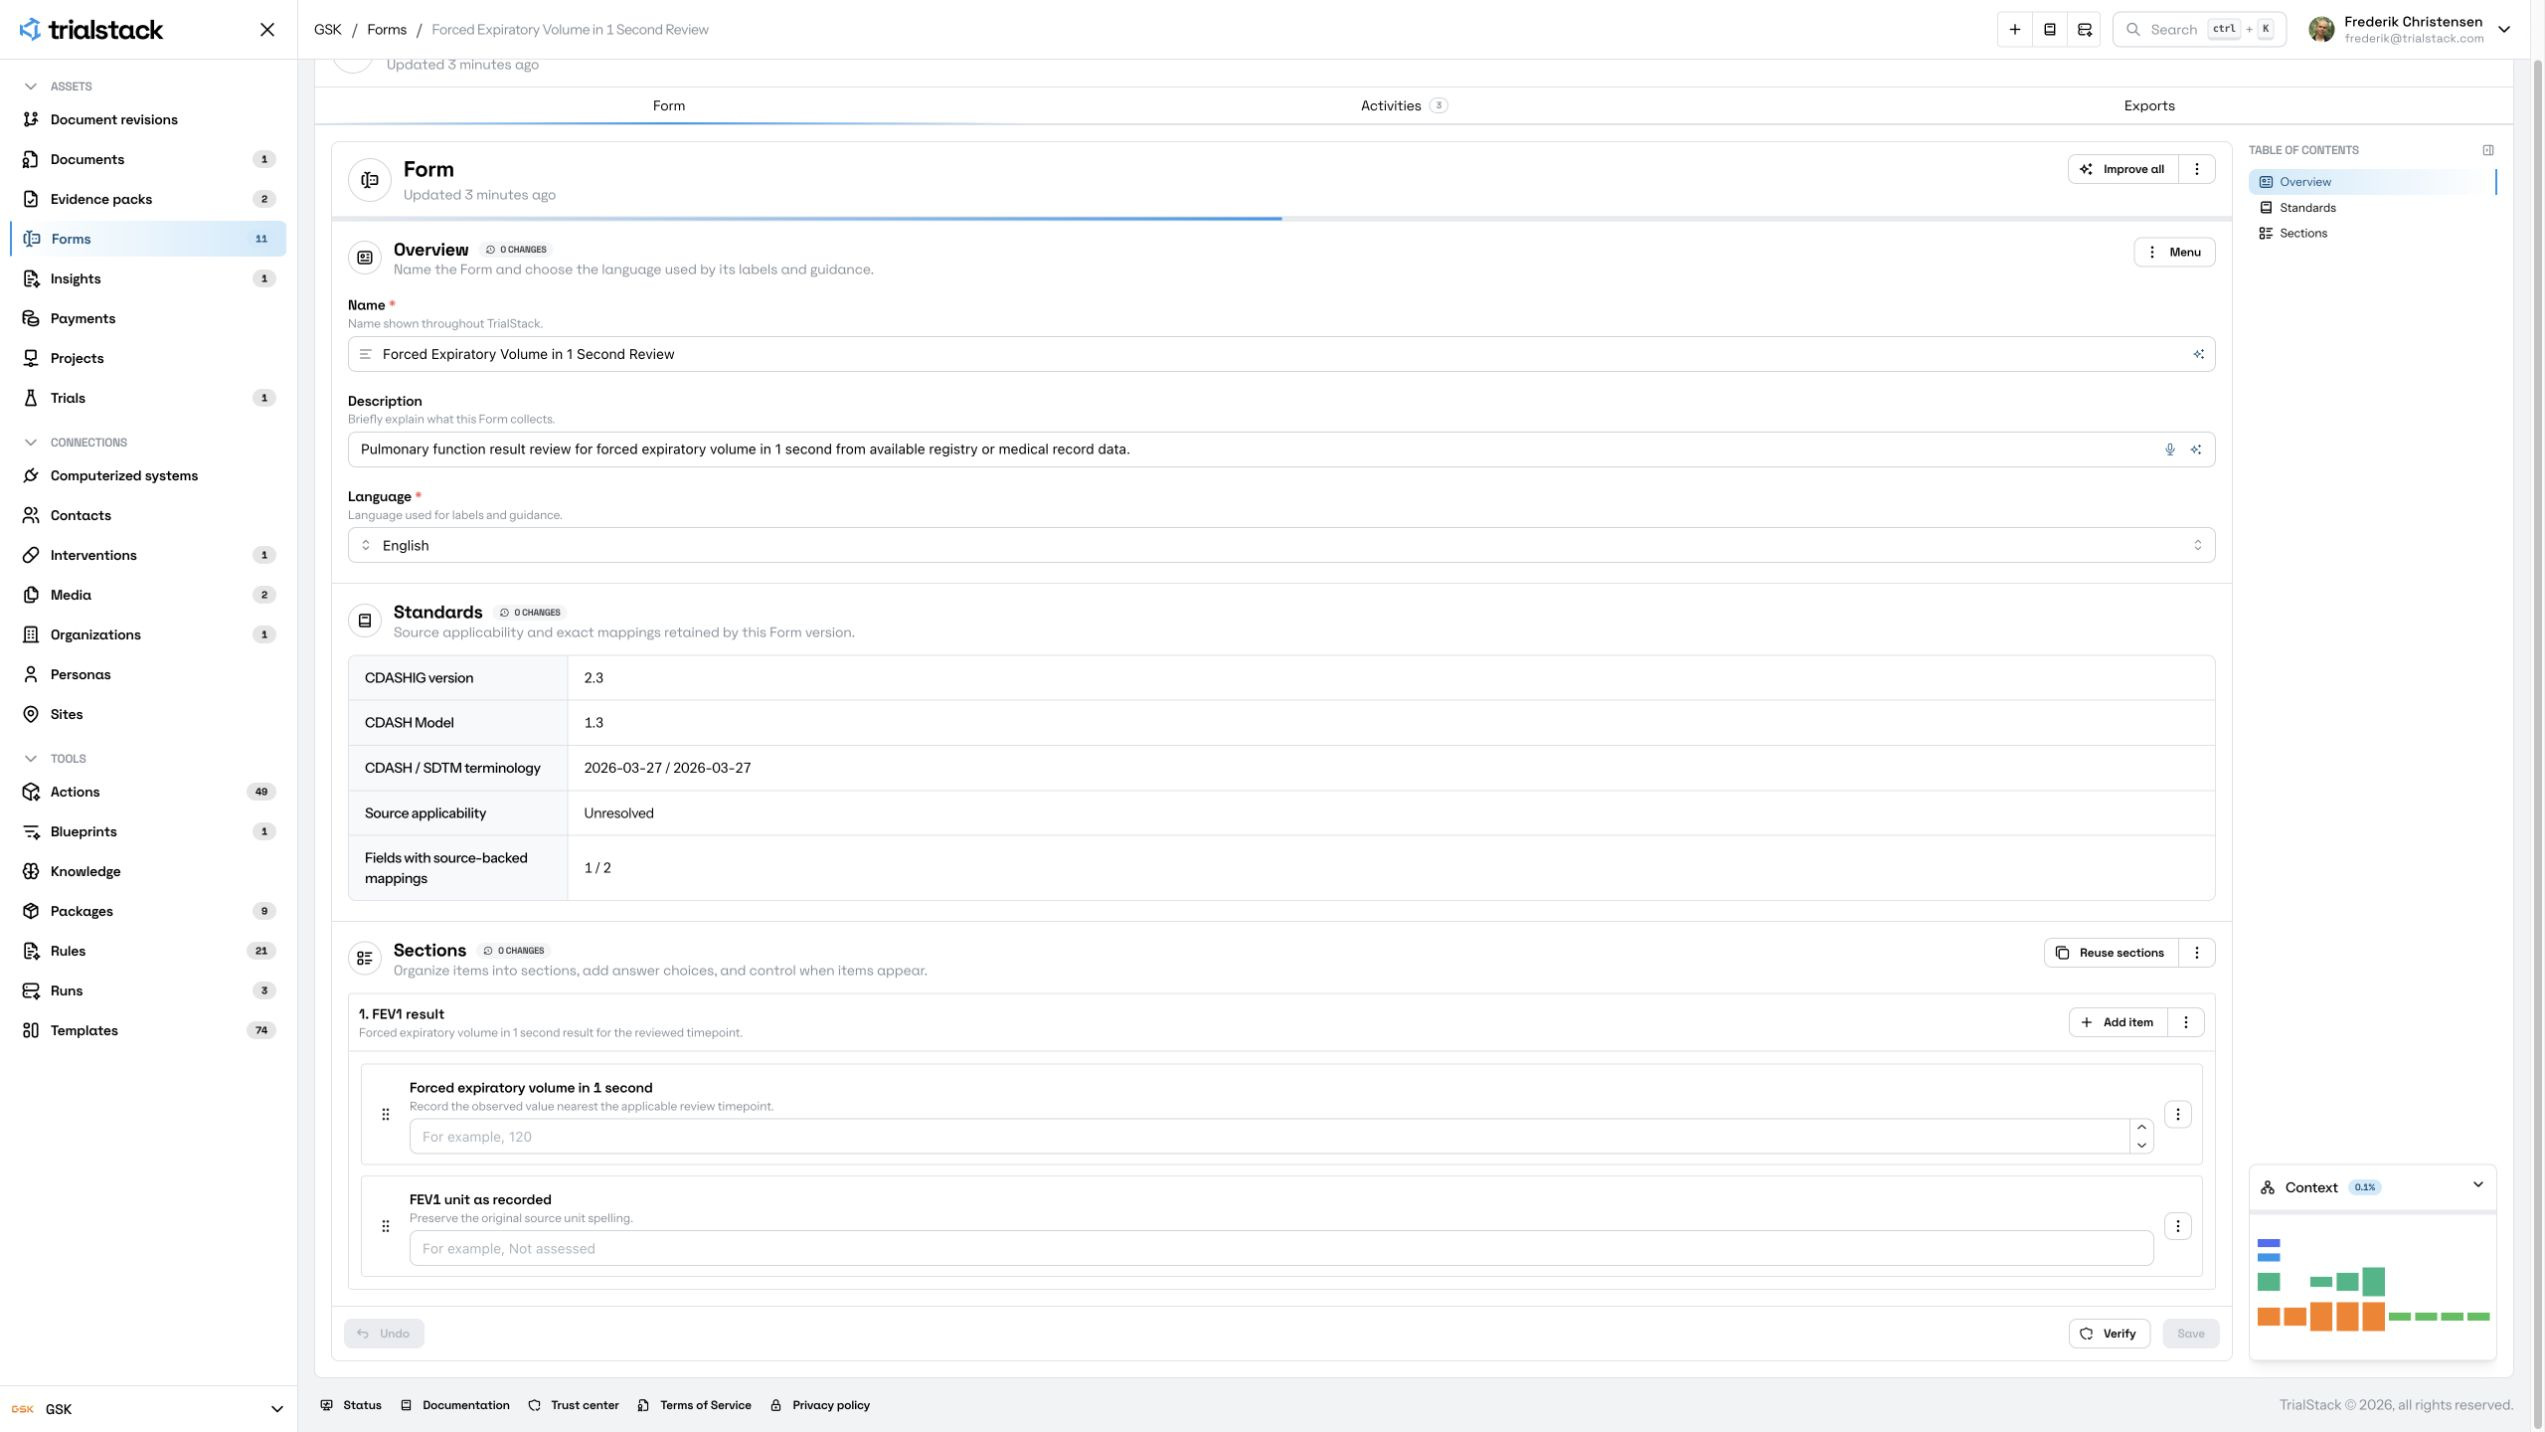
The Activities page shows what to look for in the records. One example is FEV₁, the volume a person can forcefully breathe out in one second. The demo schedules reviews at baseline, six months and twelve months. The Biomedical Concept defines the measurement. The review form records the result and the unit from the source in separate fields. The unit field maps to REORRESU in CDASH, the CDISC standard for consistent data collection. How the test was done matters too. In two sources, the published analysis used measurements taken before a bronchodilator because measurements after it were unavailable. The available records also left some planned outcomes unanswered, including loss of smell.
Teams can use CDISC Biomedical Concepts for measurements such as FEV₁ and eosinophil count. They can also keep their own Biomedical Concepts for trial-specific measures, such as how to count a qualifying asthma flare-up. The schedule generated in 2 min 32 sec as part of a 16 min 16 sec planning run.
3. Lock the analysis before programming
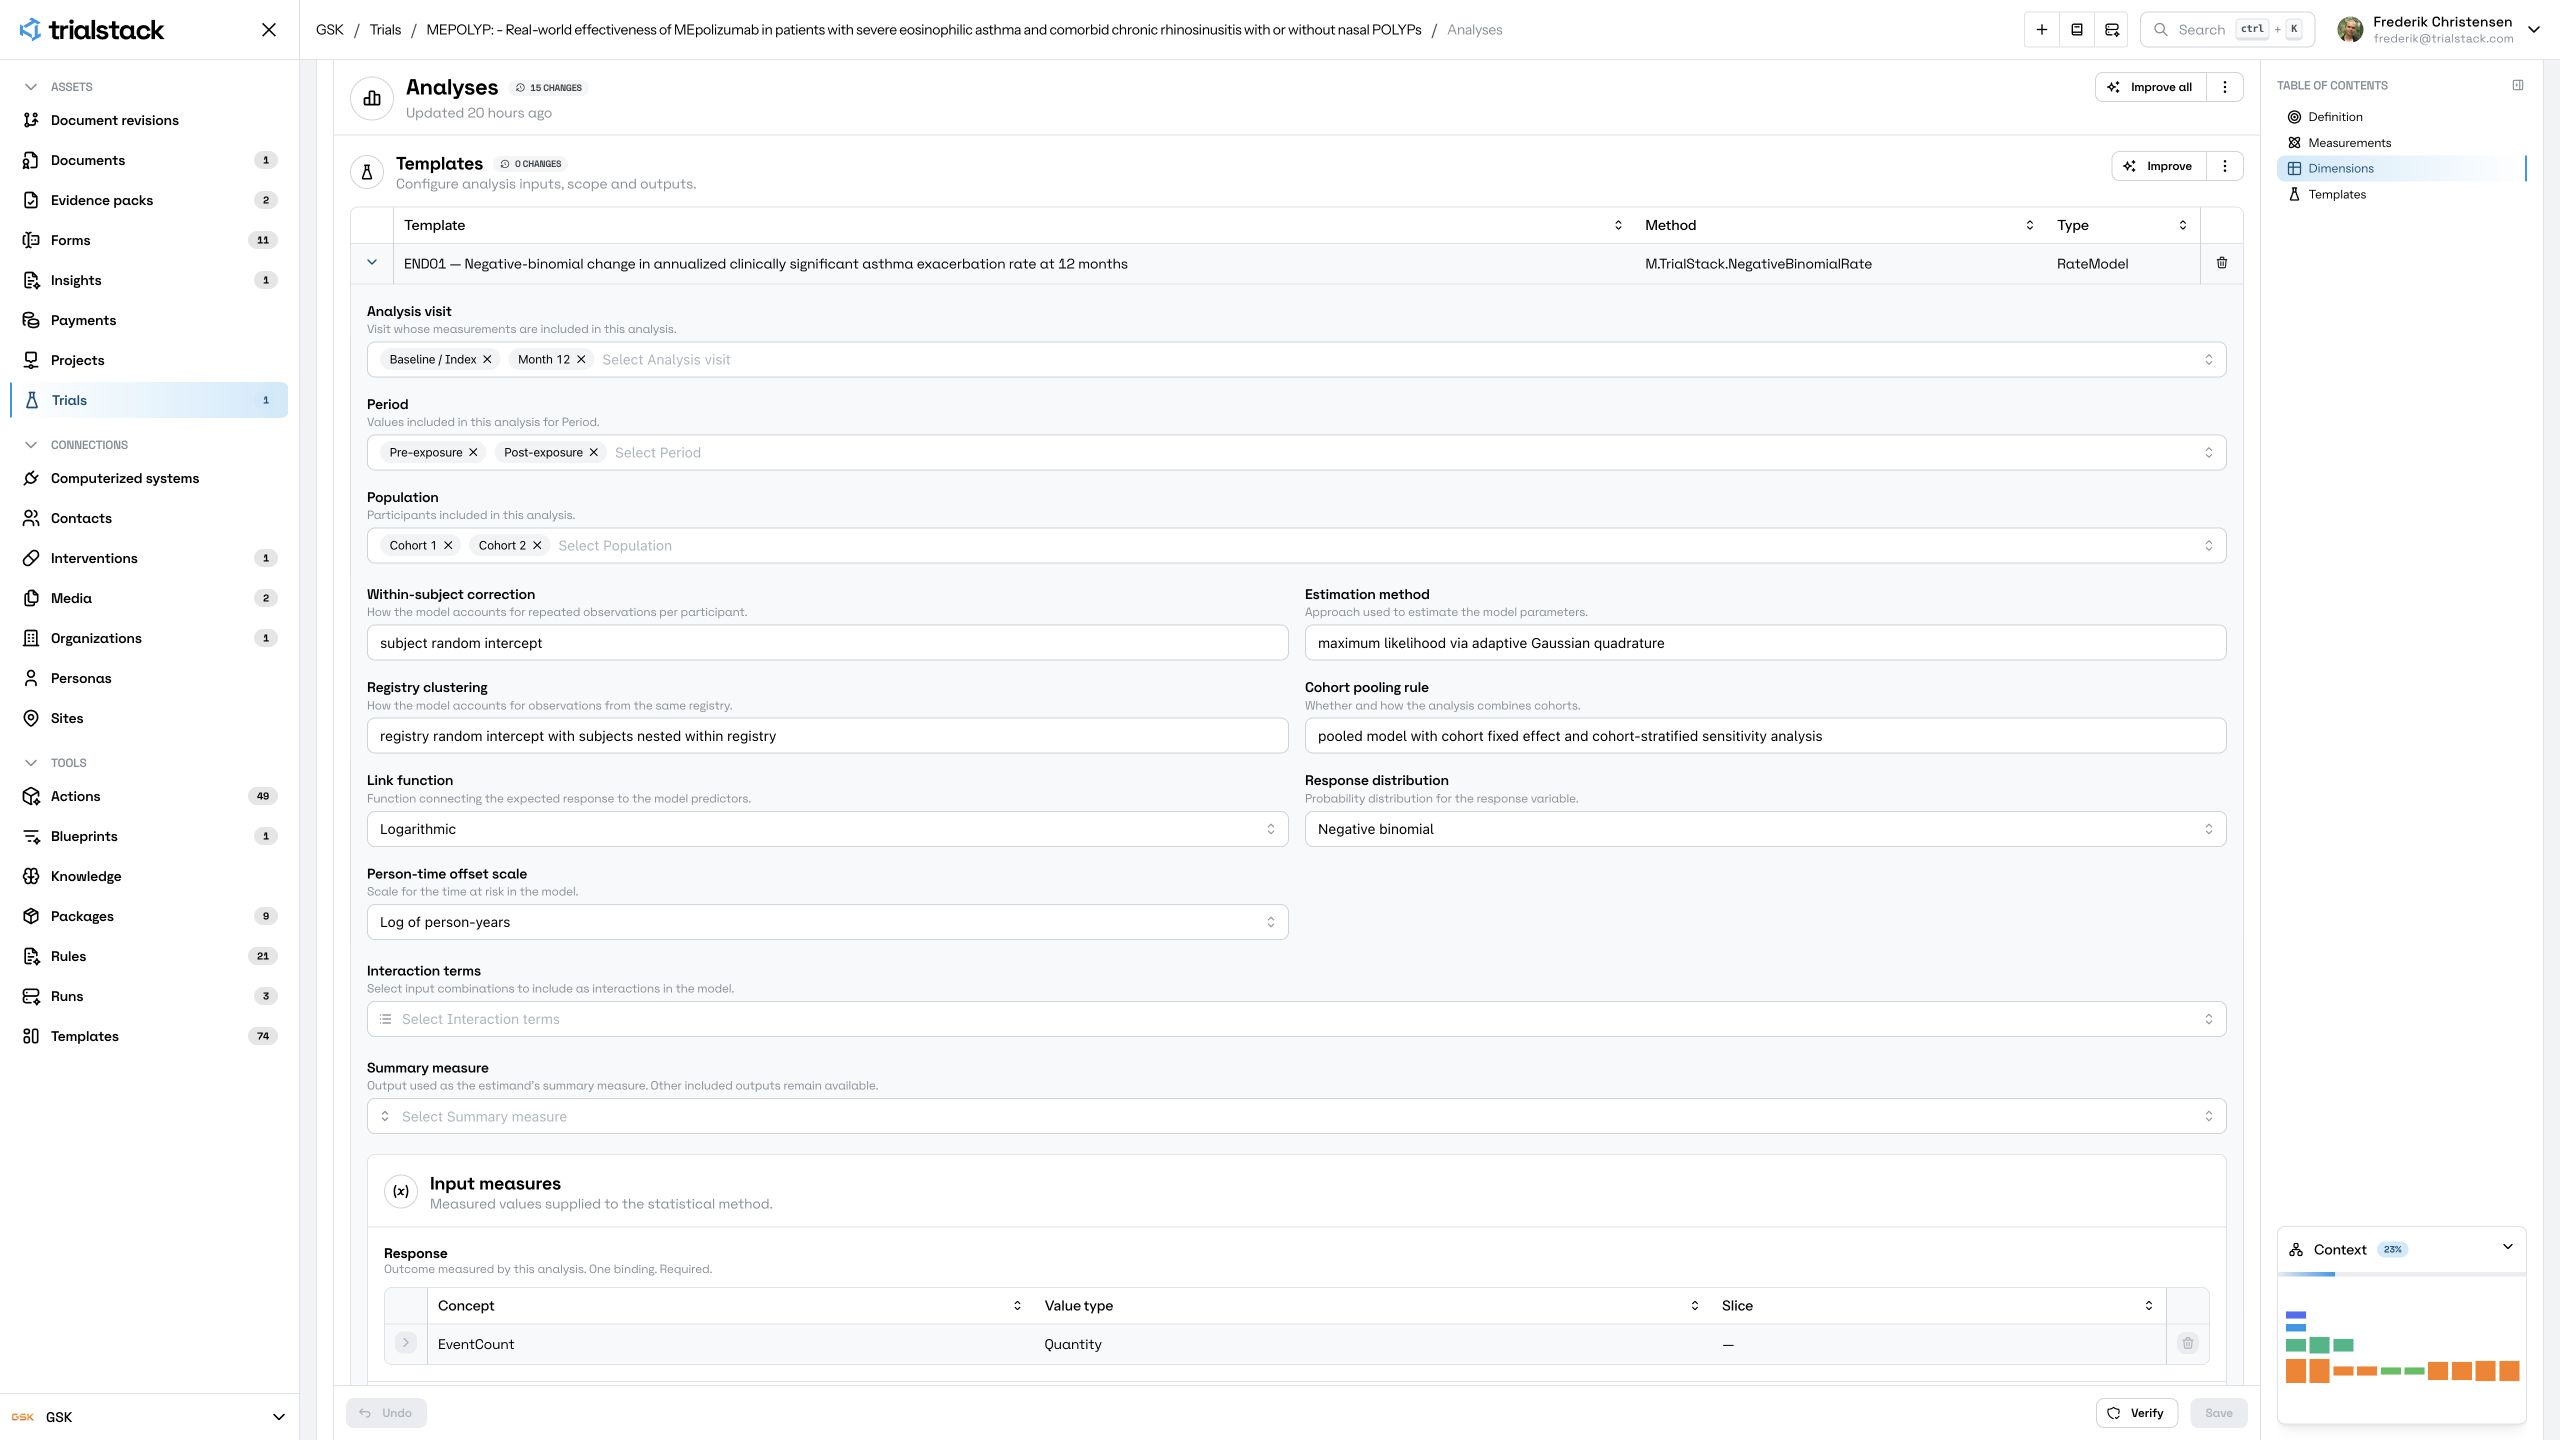
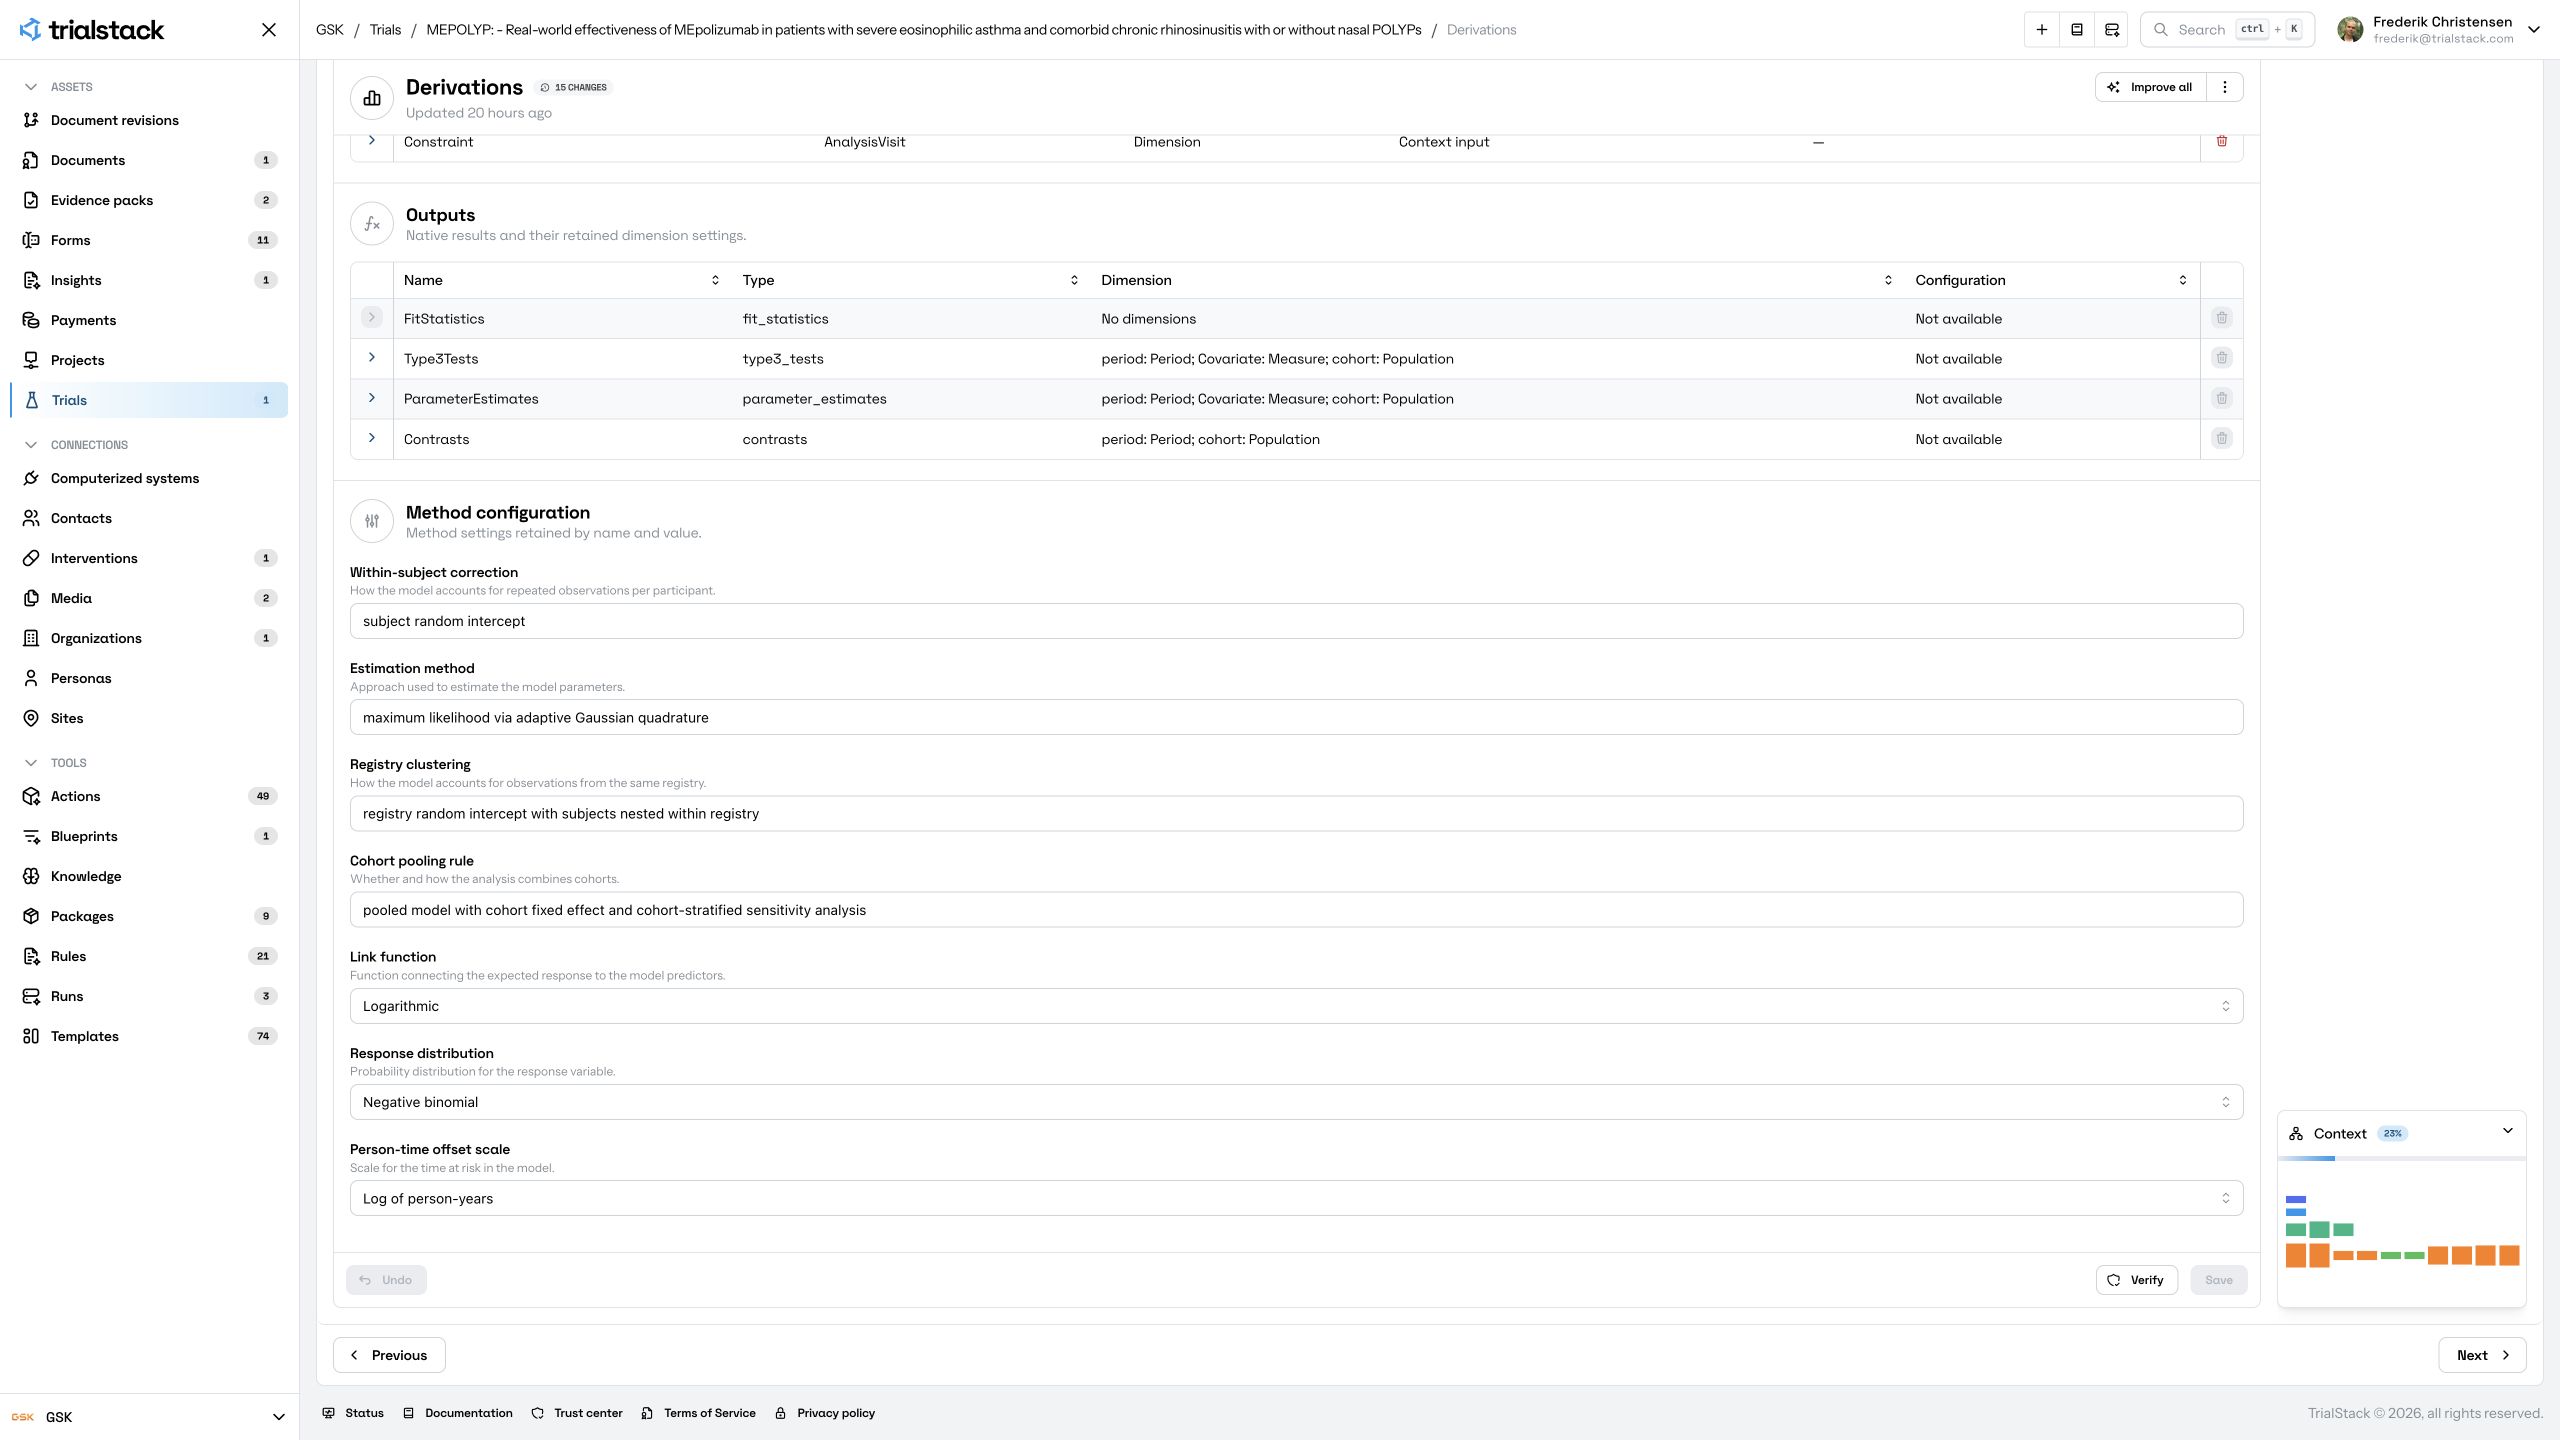
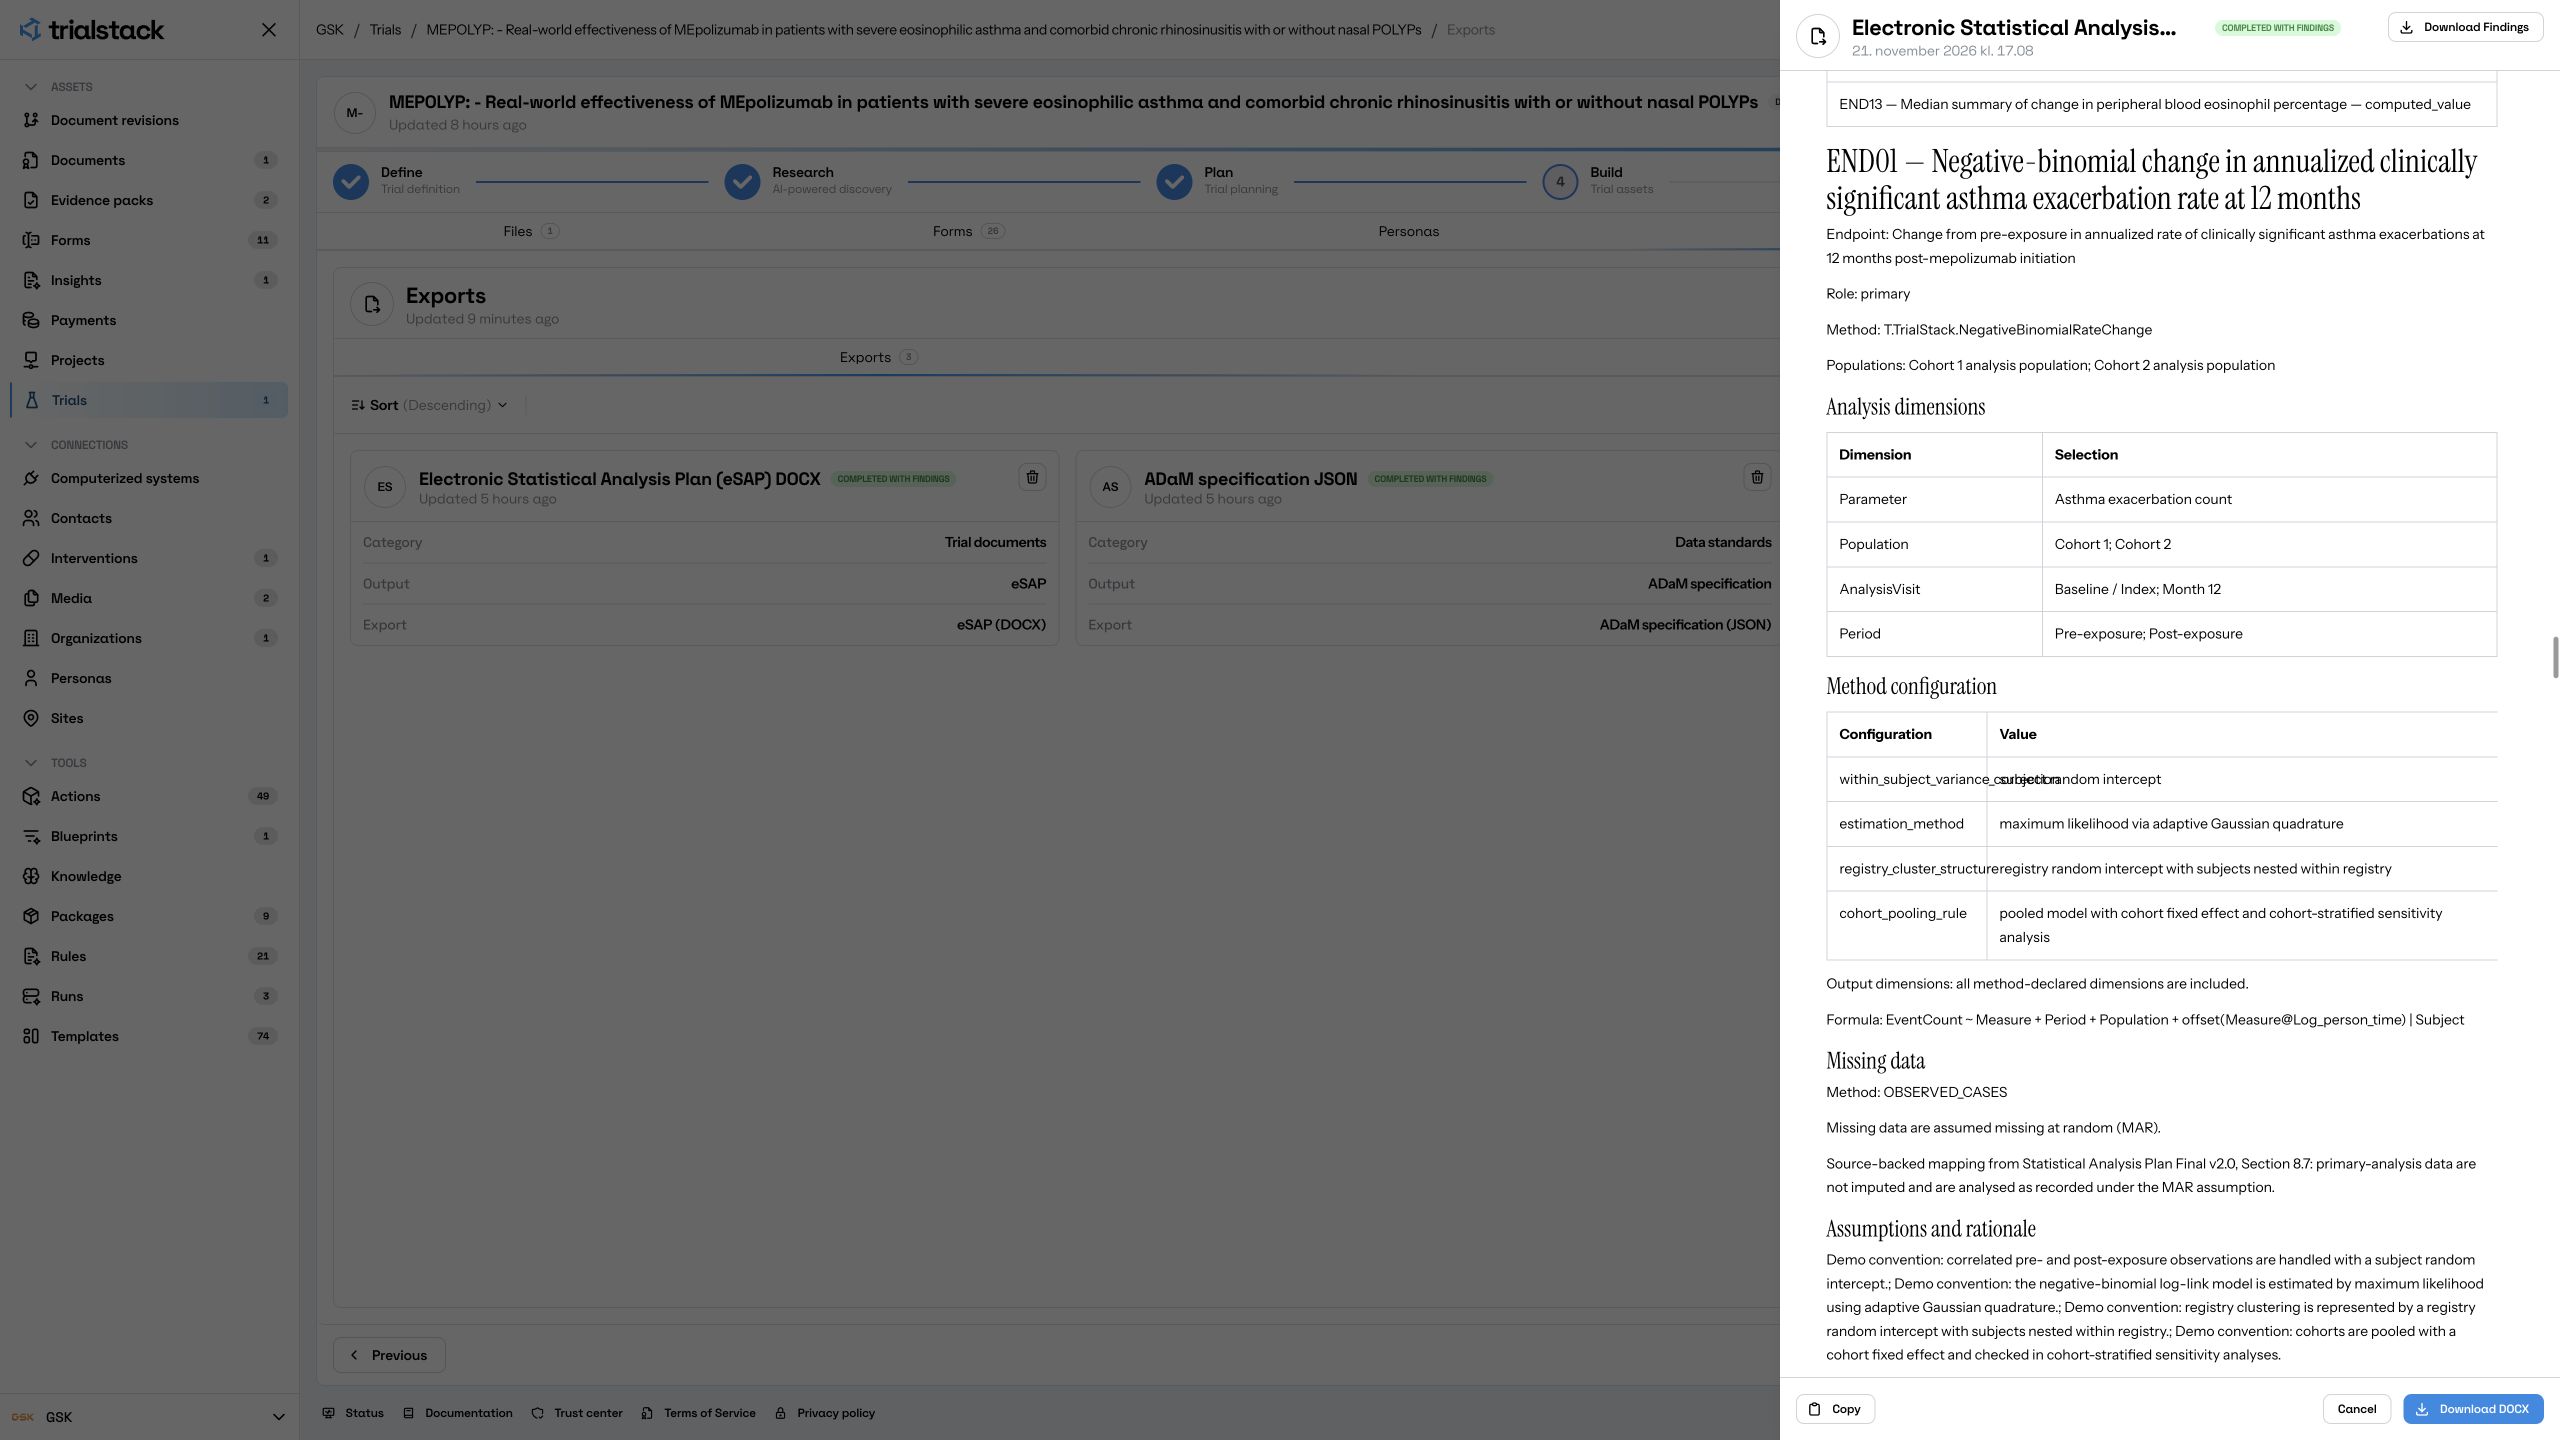
The public statistical analysis plan (SAP) specified a separate analysis for each patient group. It used negative binomial regression to compare rates while accounting for observed follow-up time and repeated observations from the same person. The plan used the available records for the primary analysis without filling in missing values.
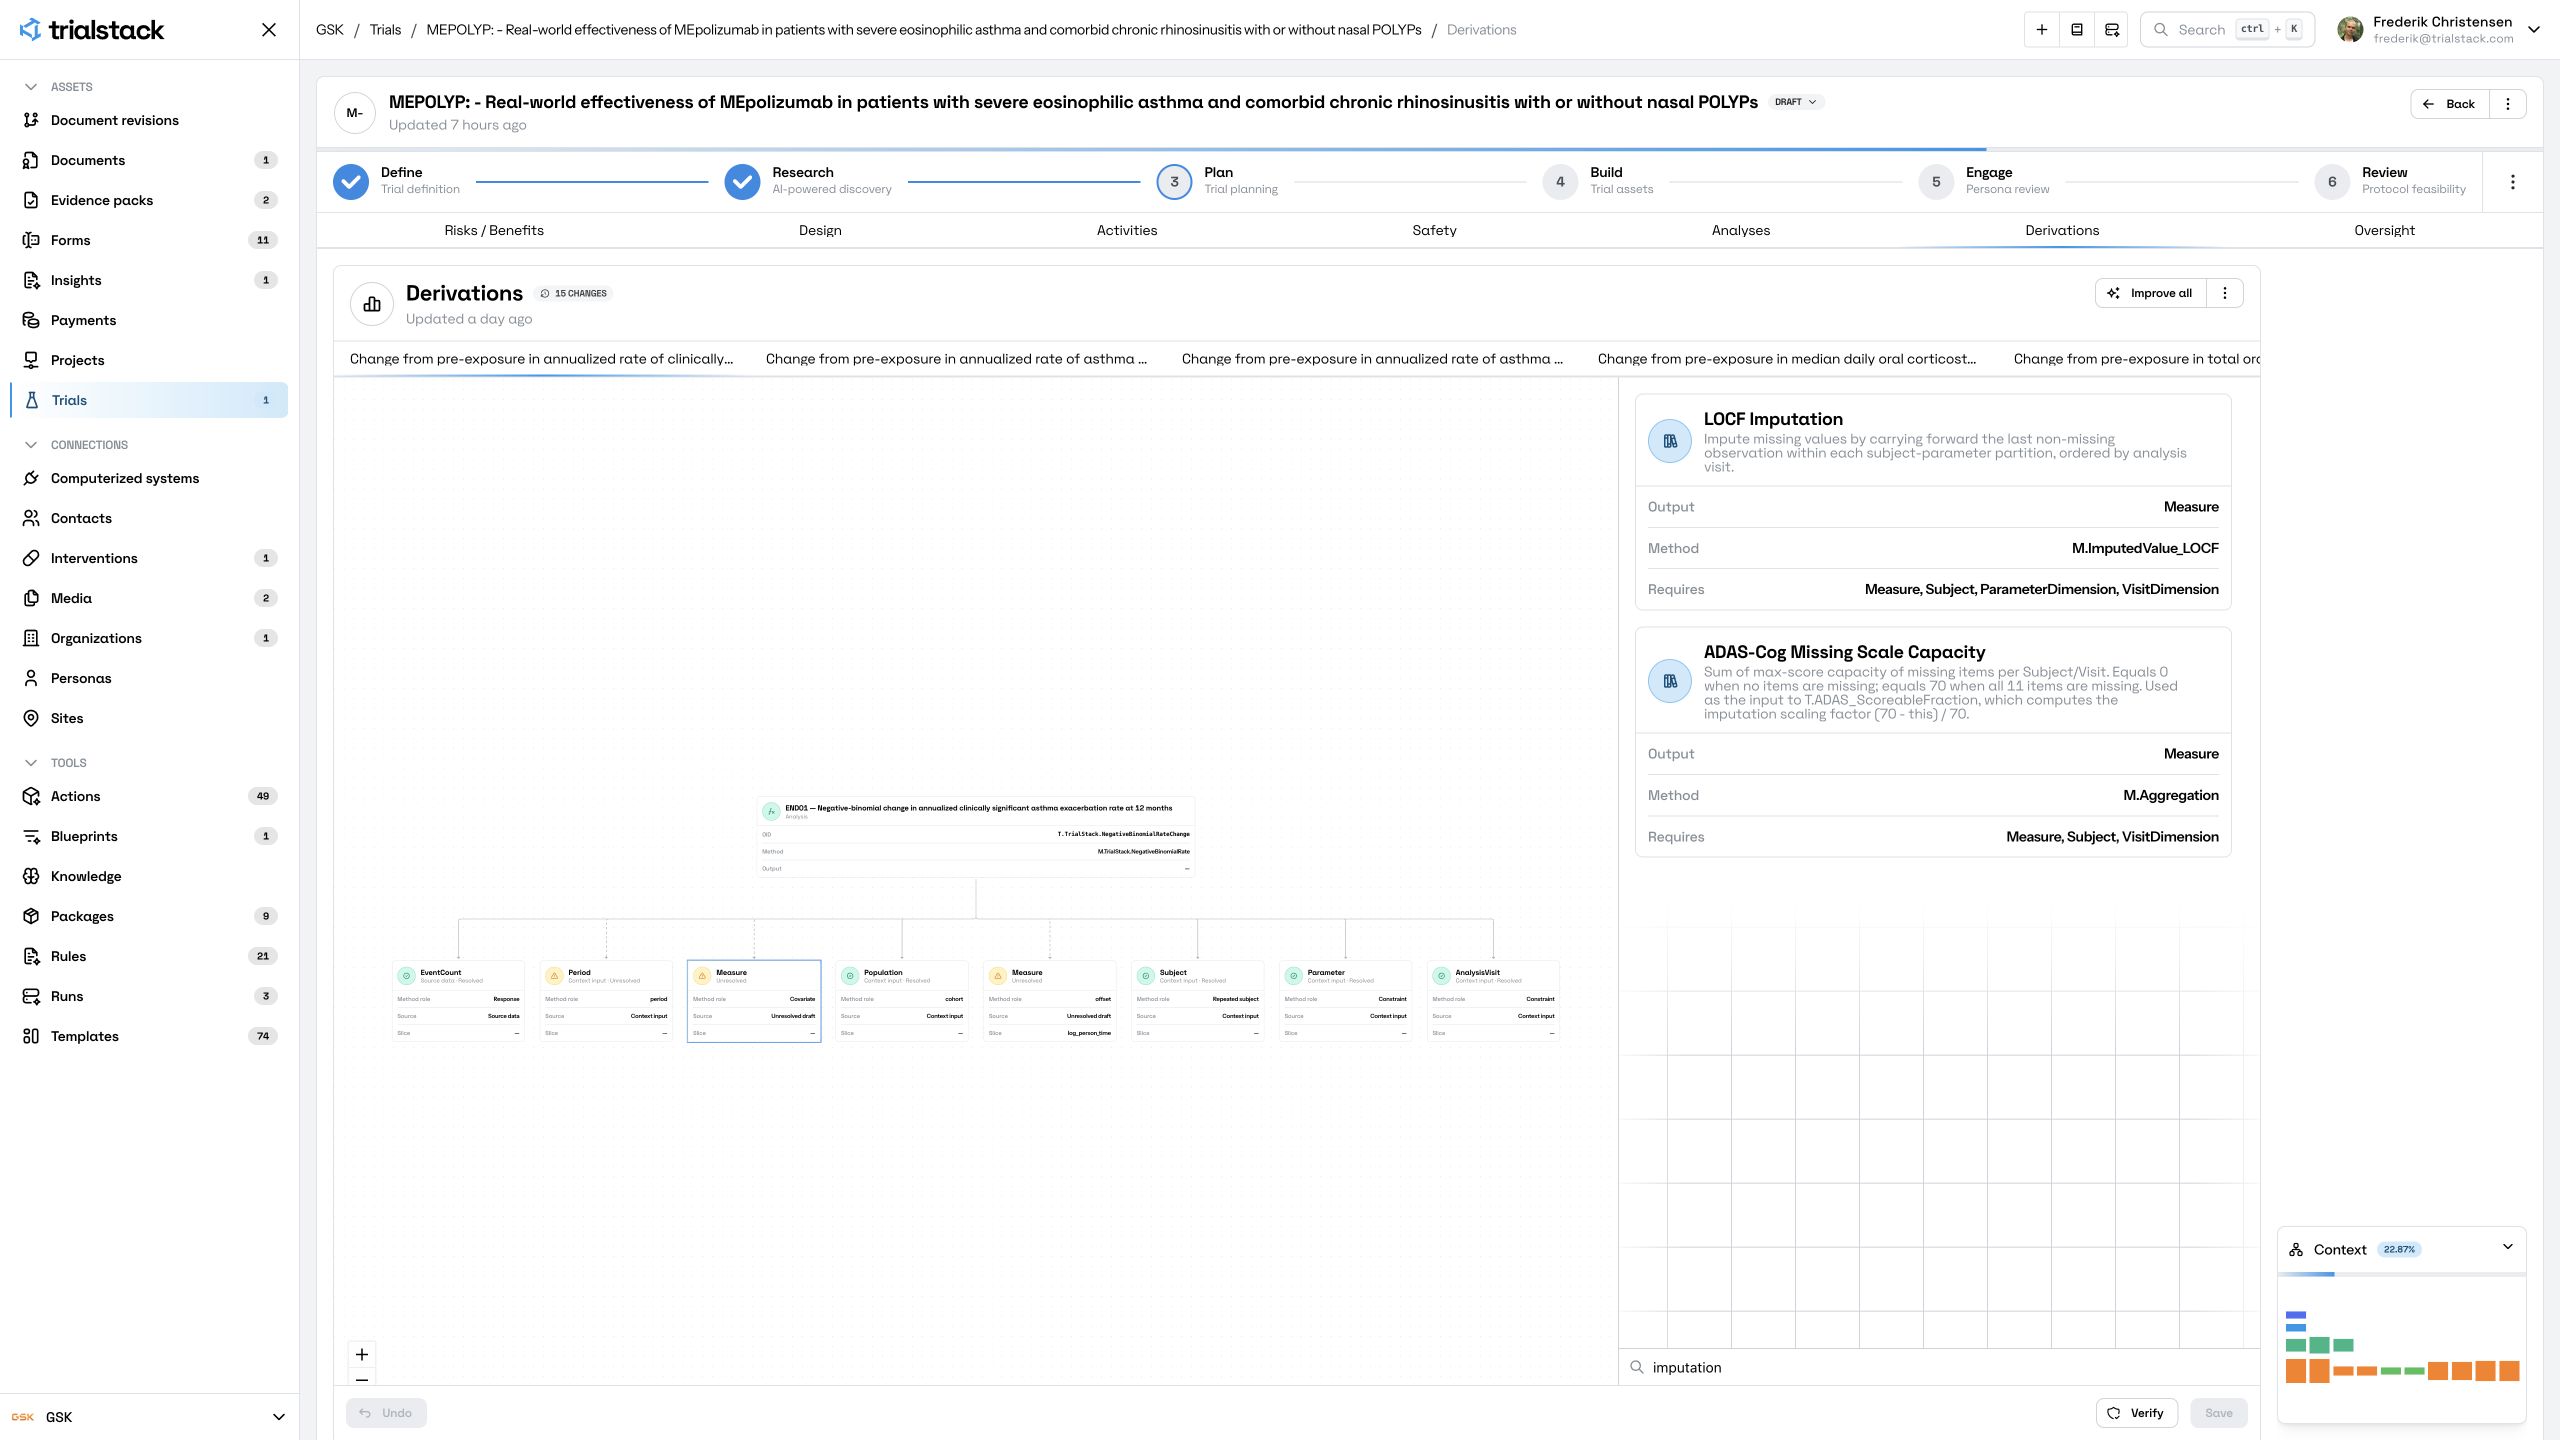
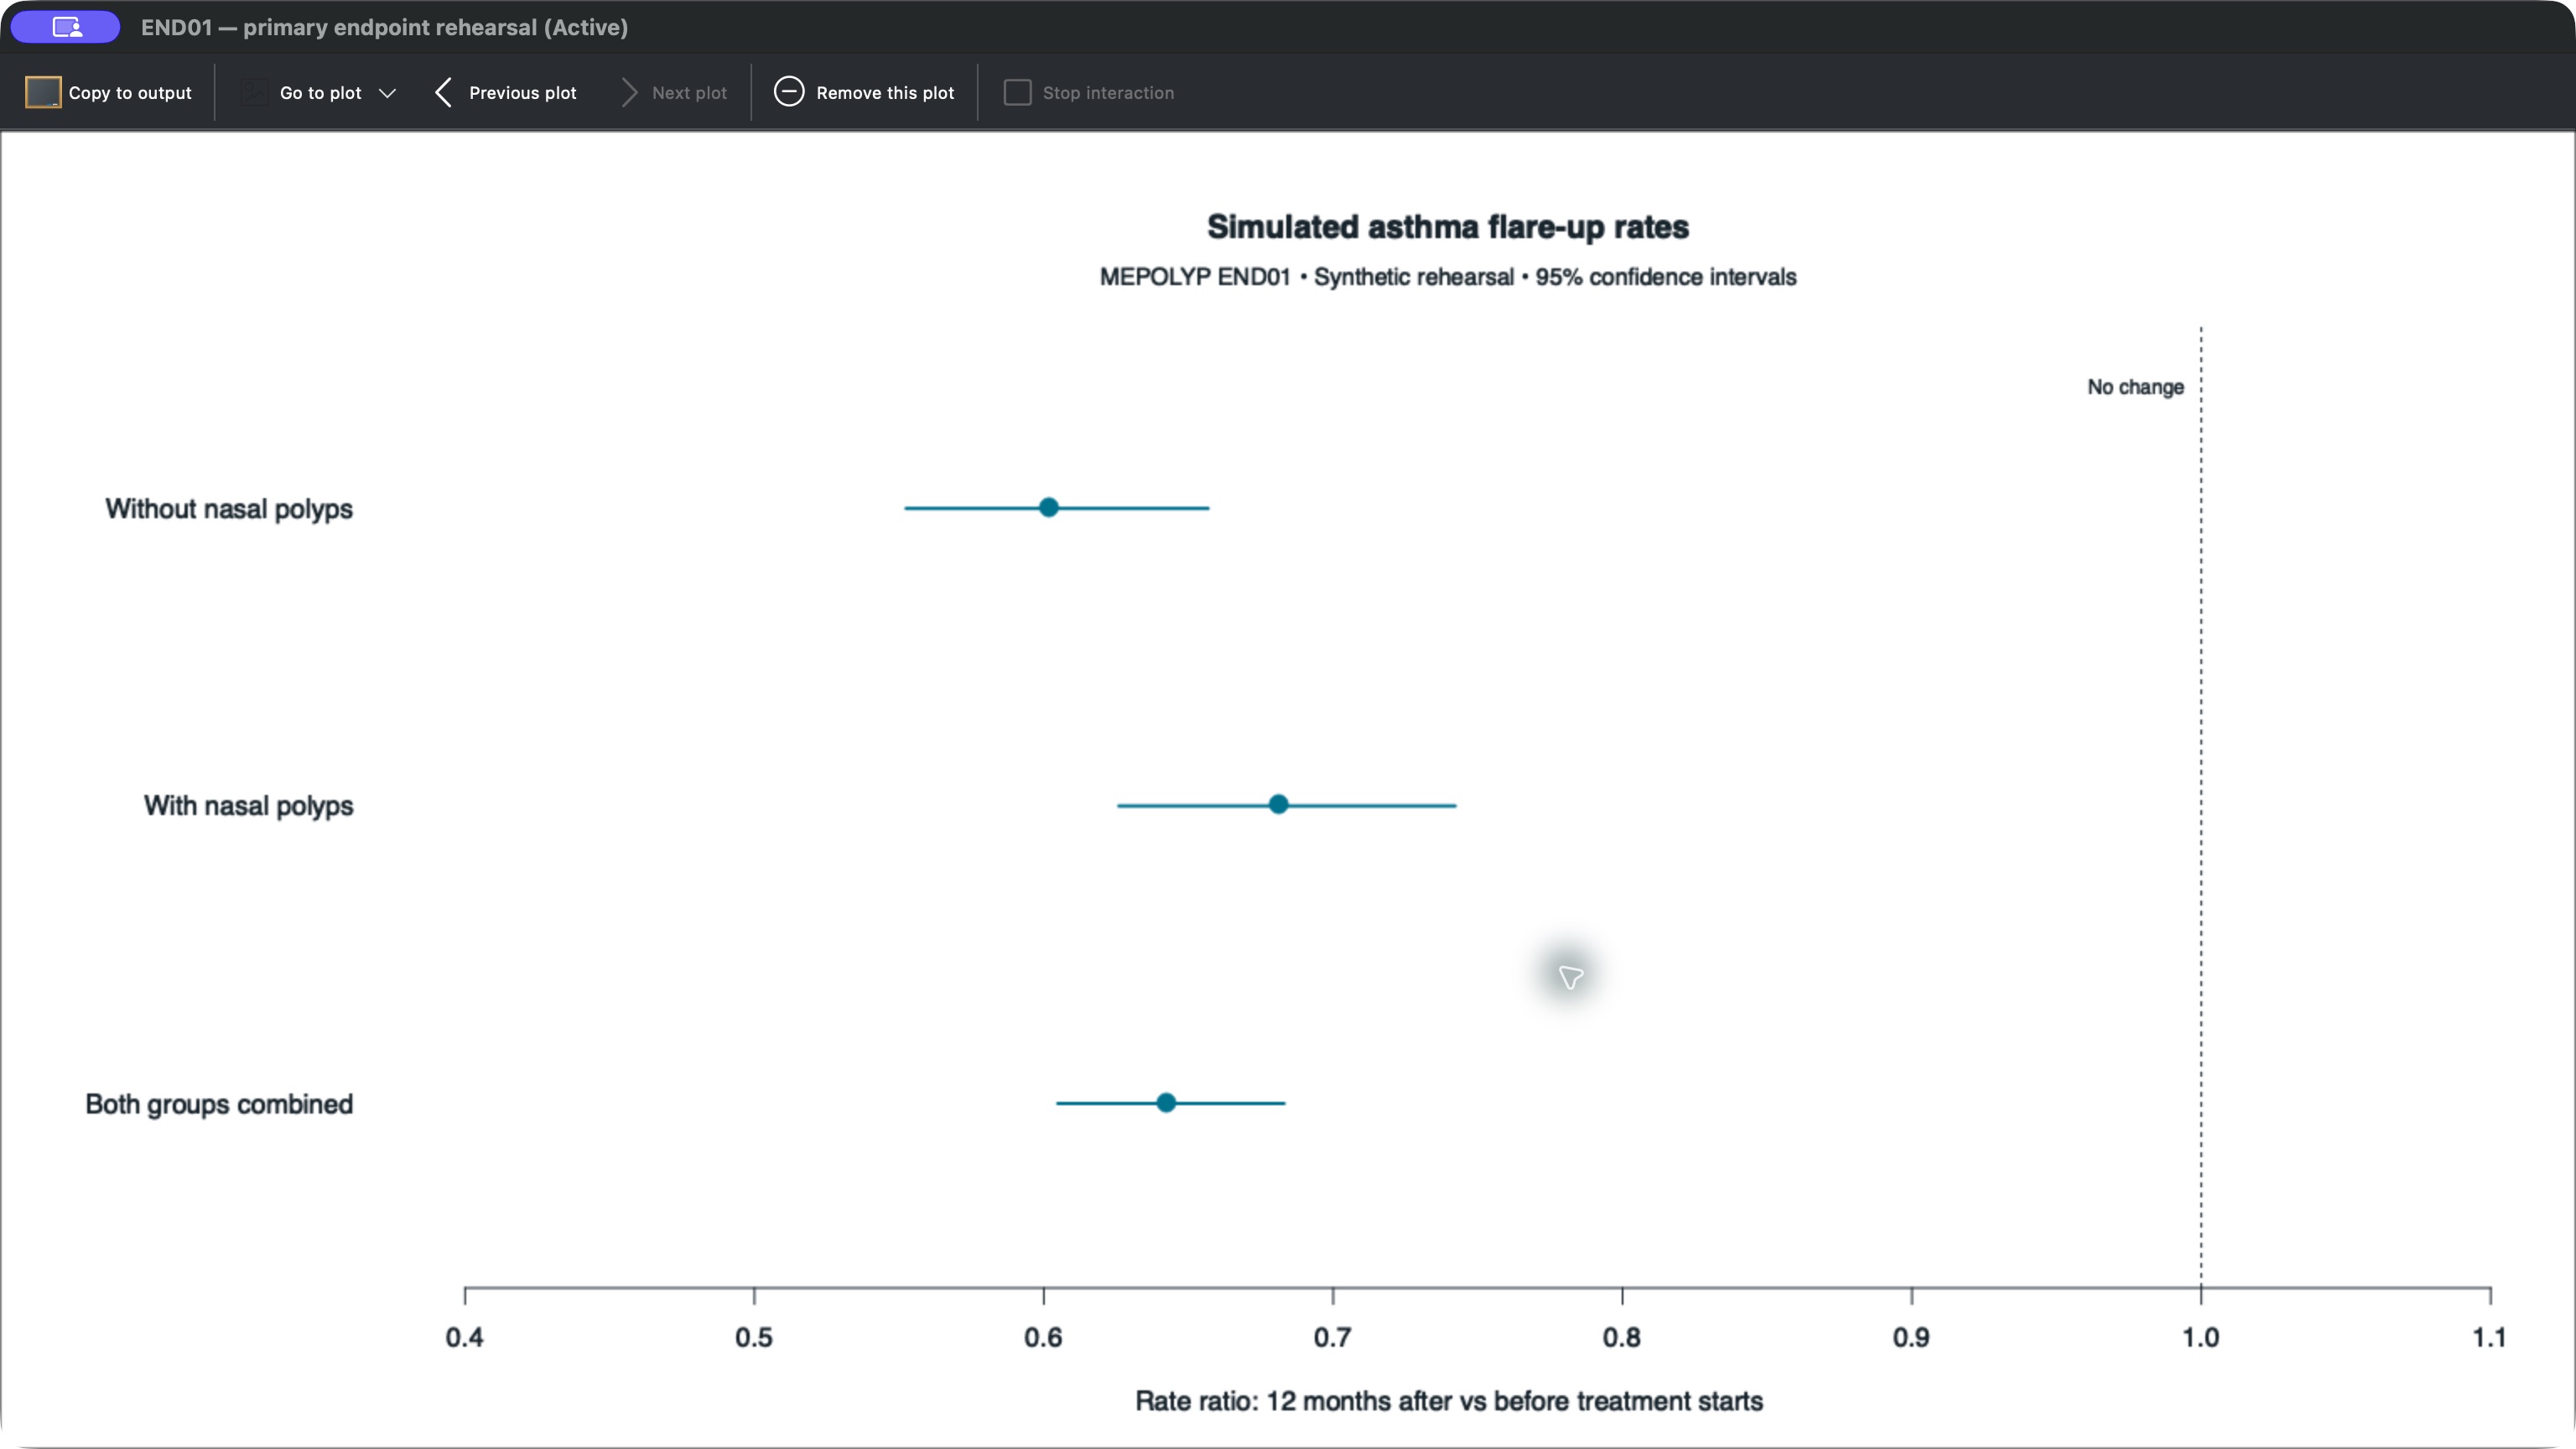
The main demo model shown below combines both groups, with separate fits to see how the estimates vary by group. The Analysis and Derivations pages show how the question connects to the model inputs and the results the team plans to review.
4. Carry accepted decisions into every handoff
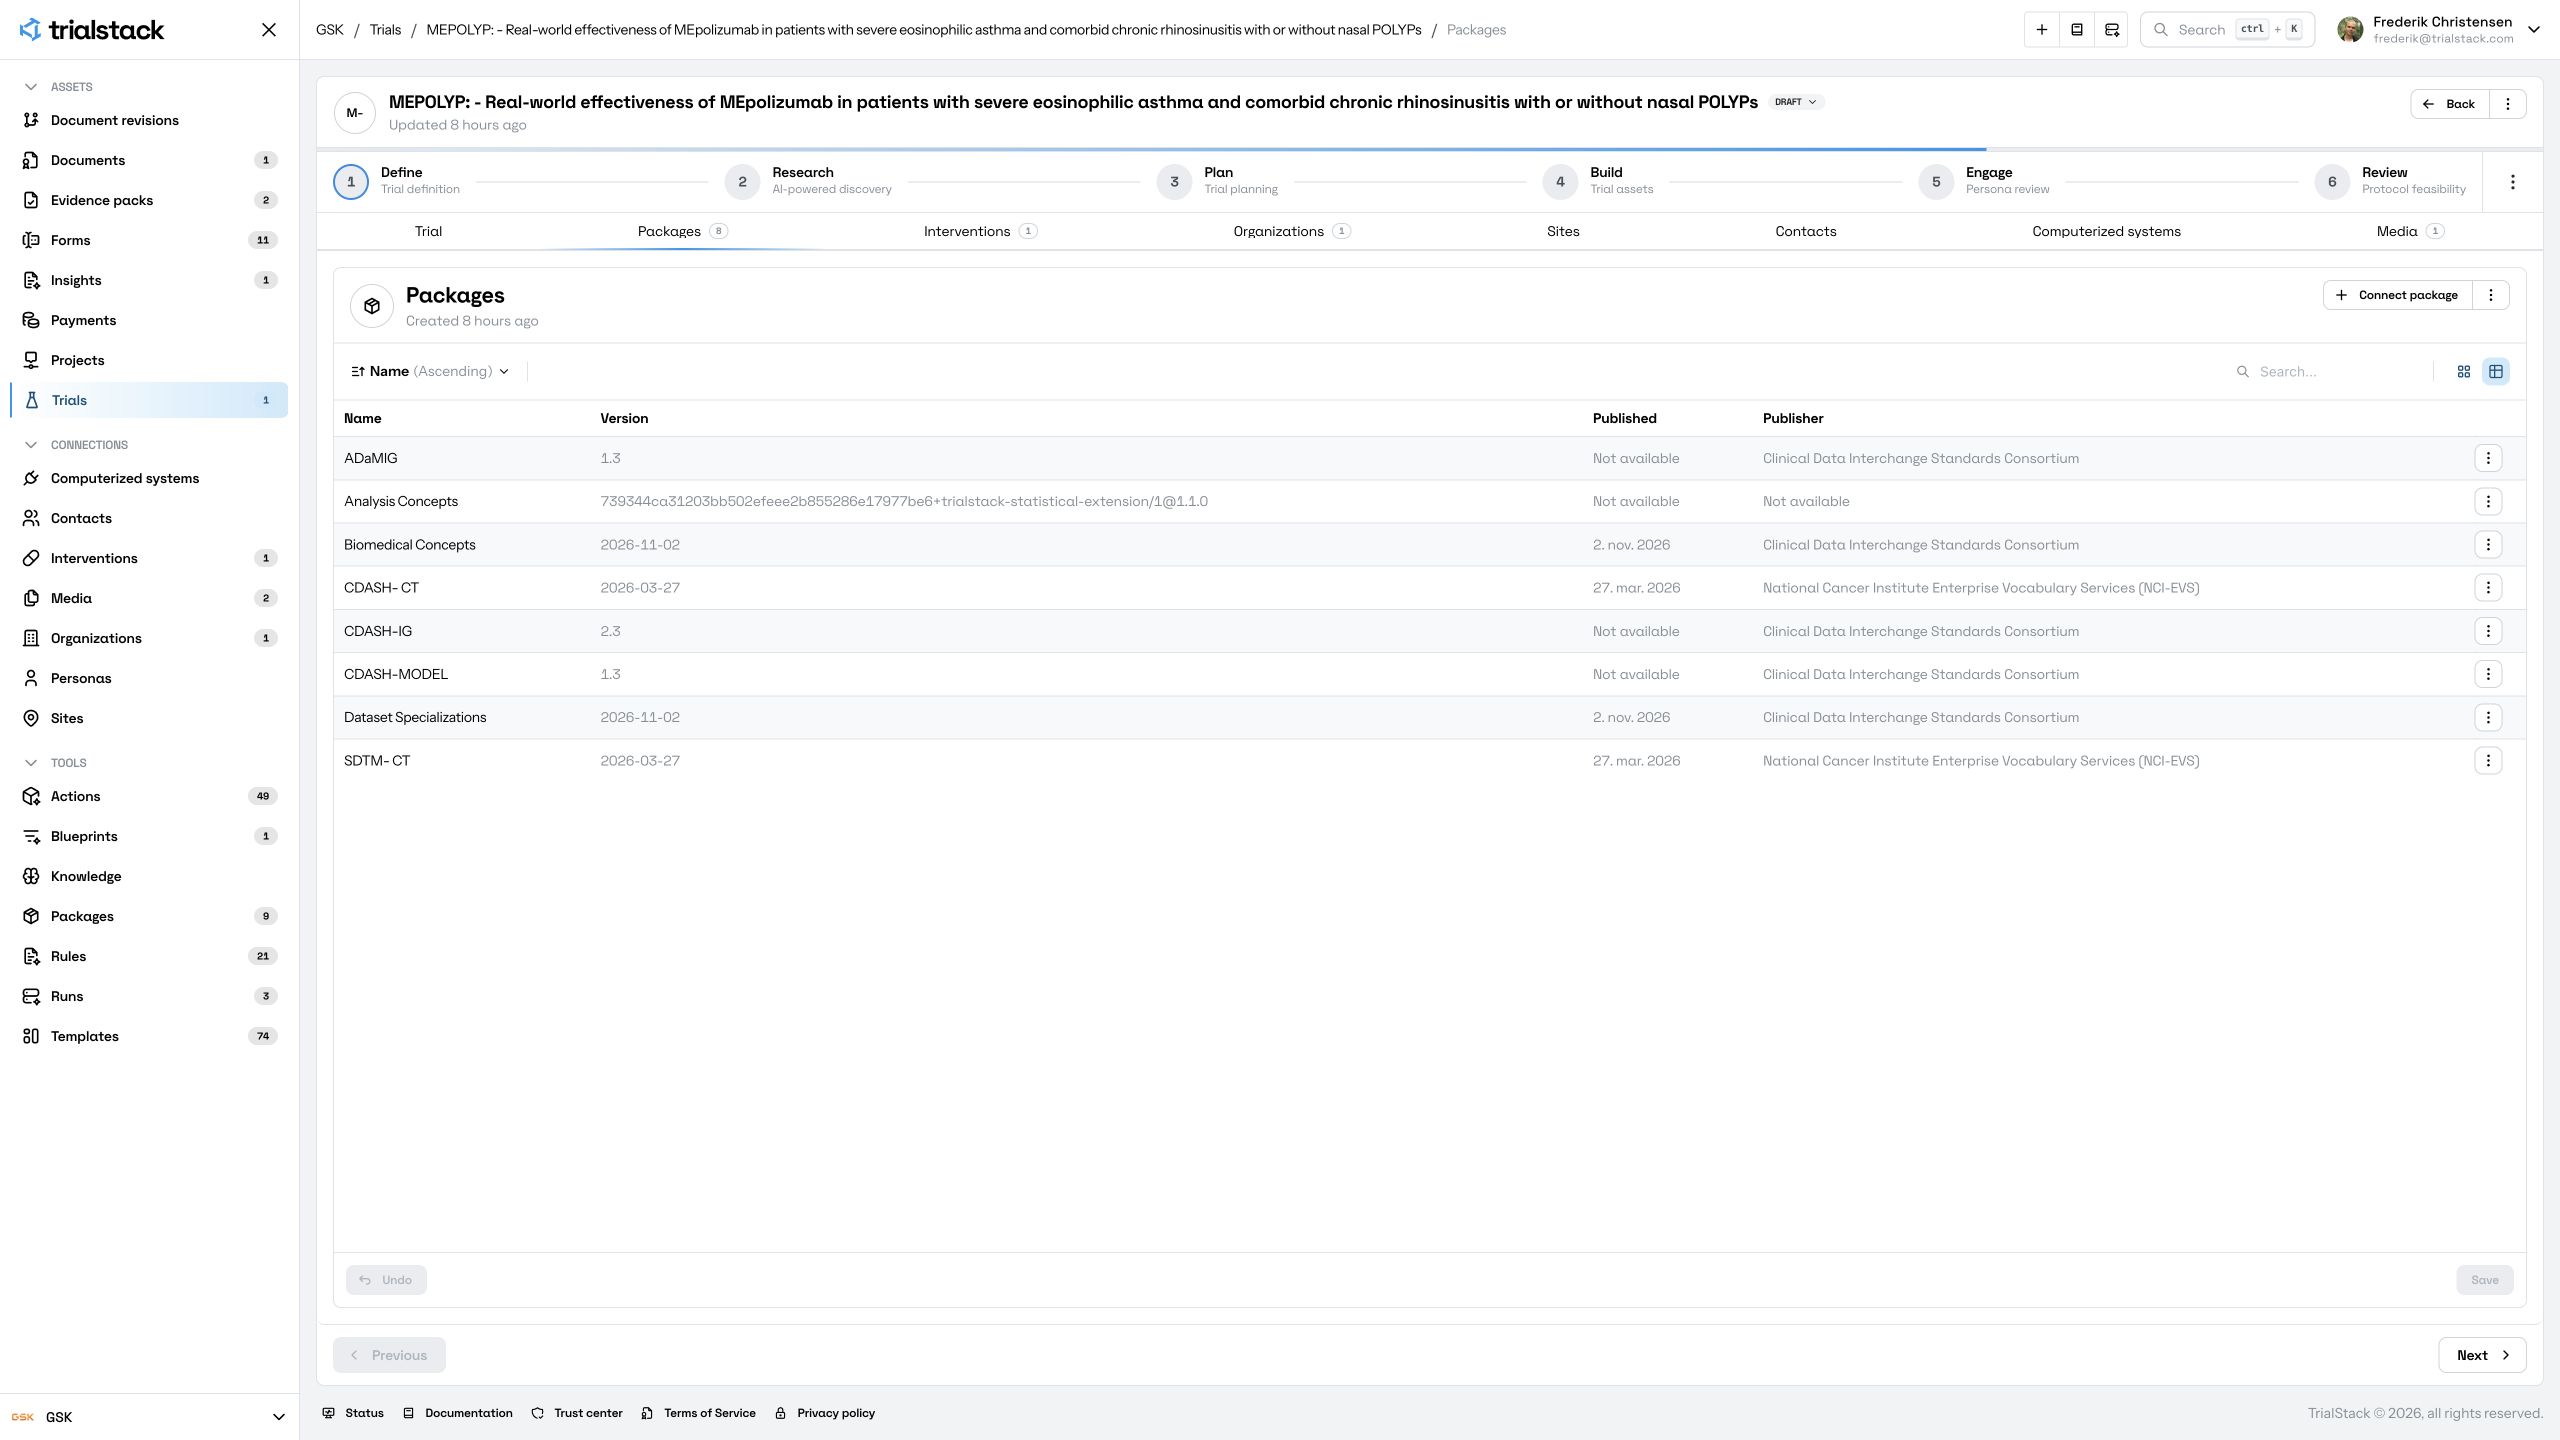
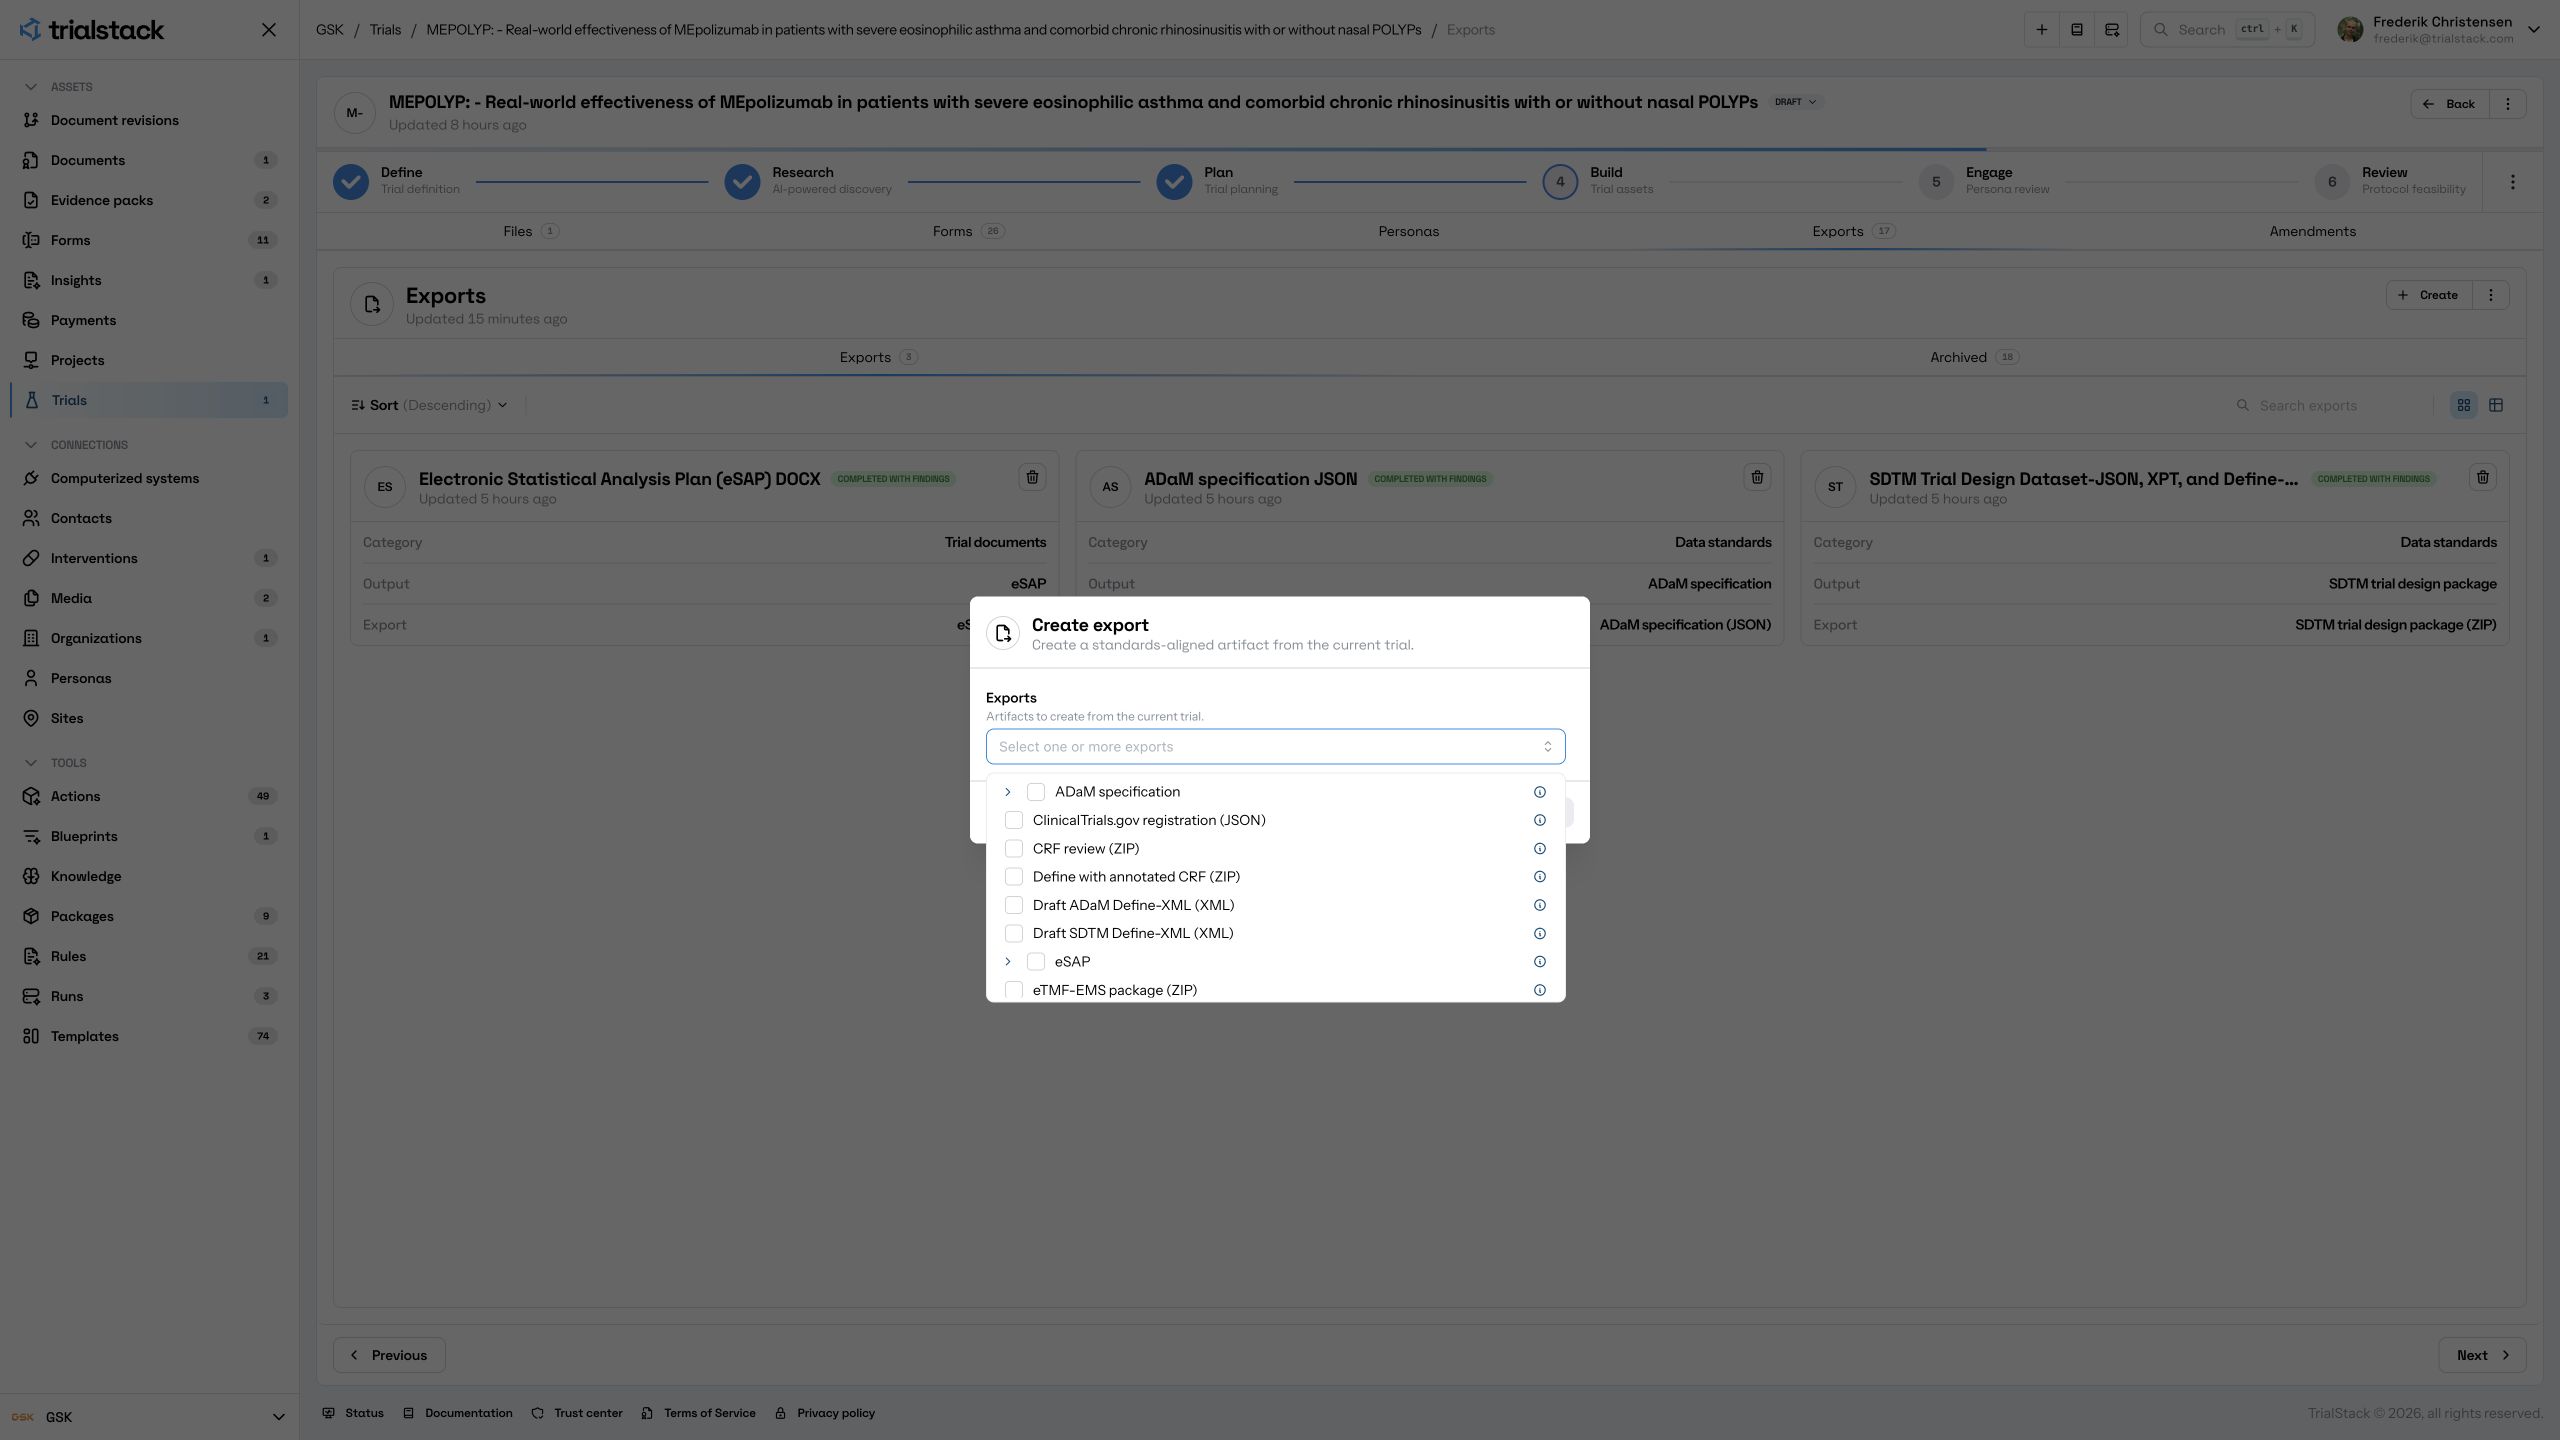
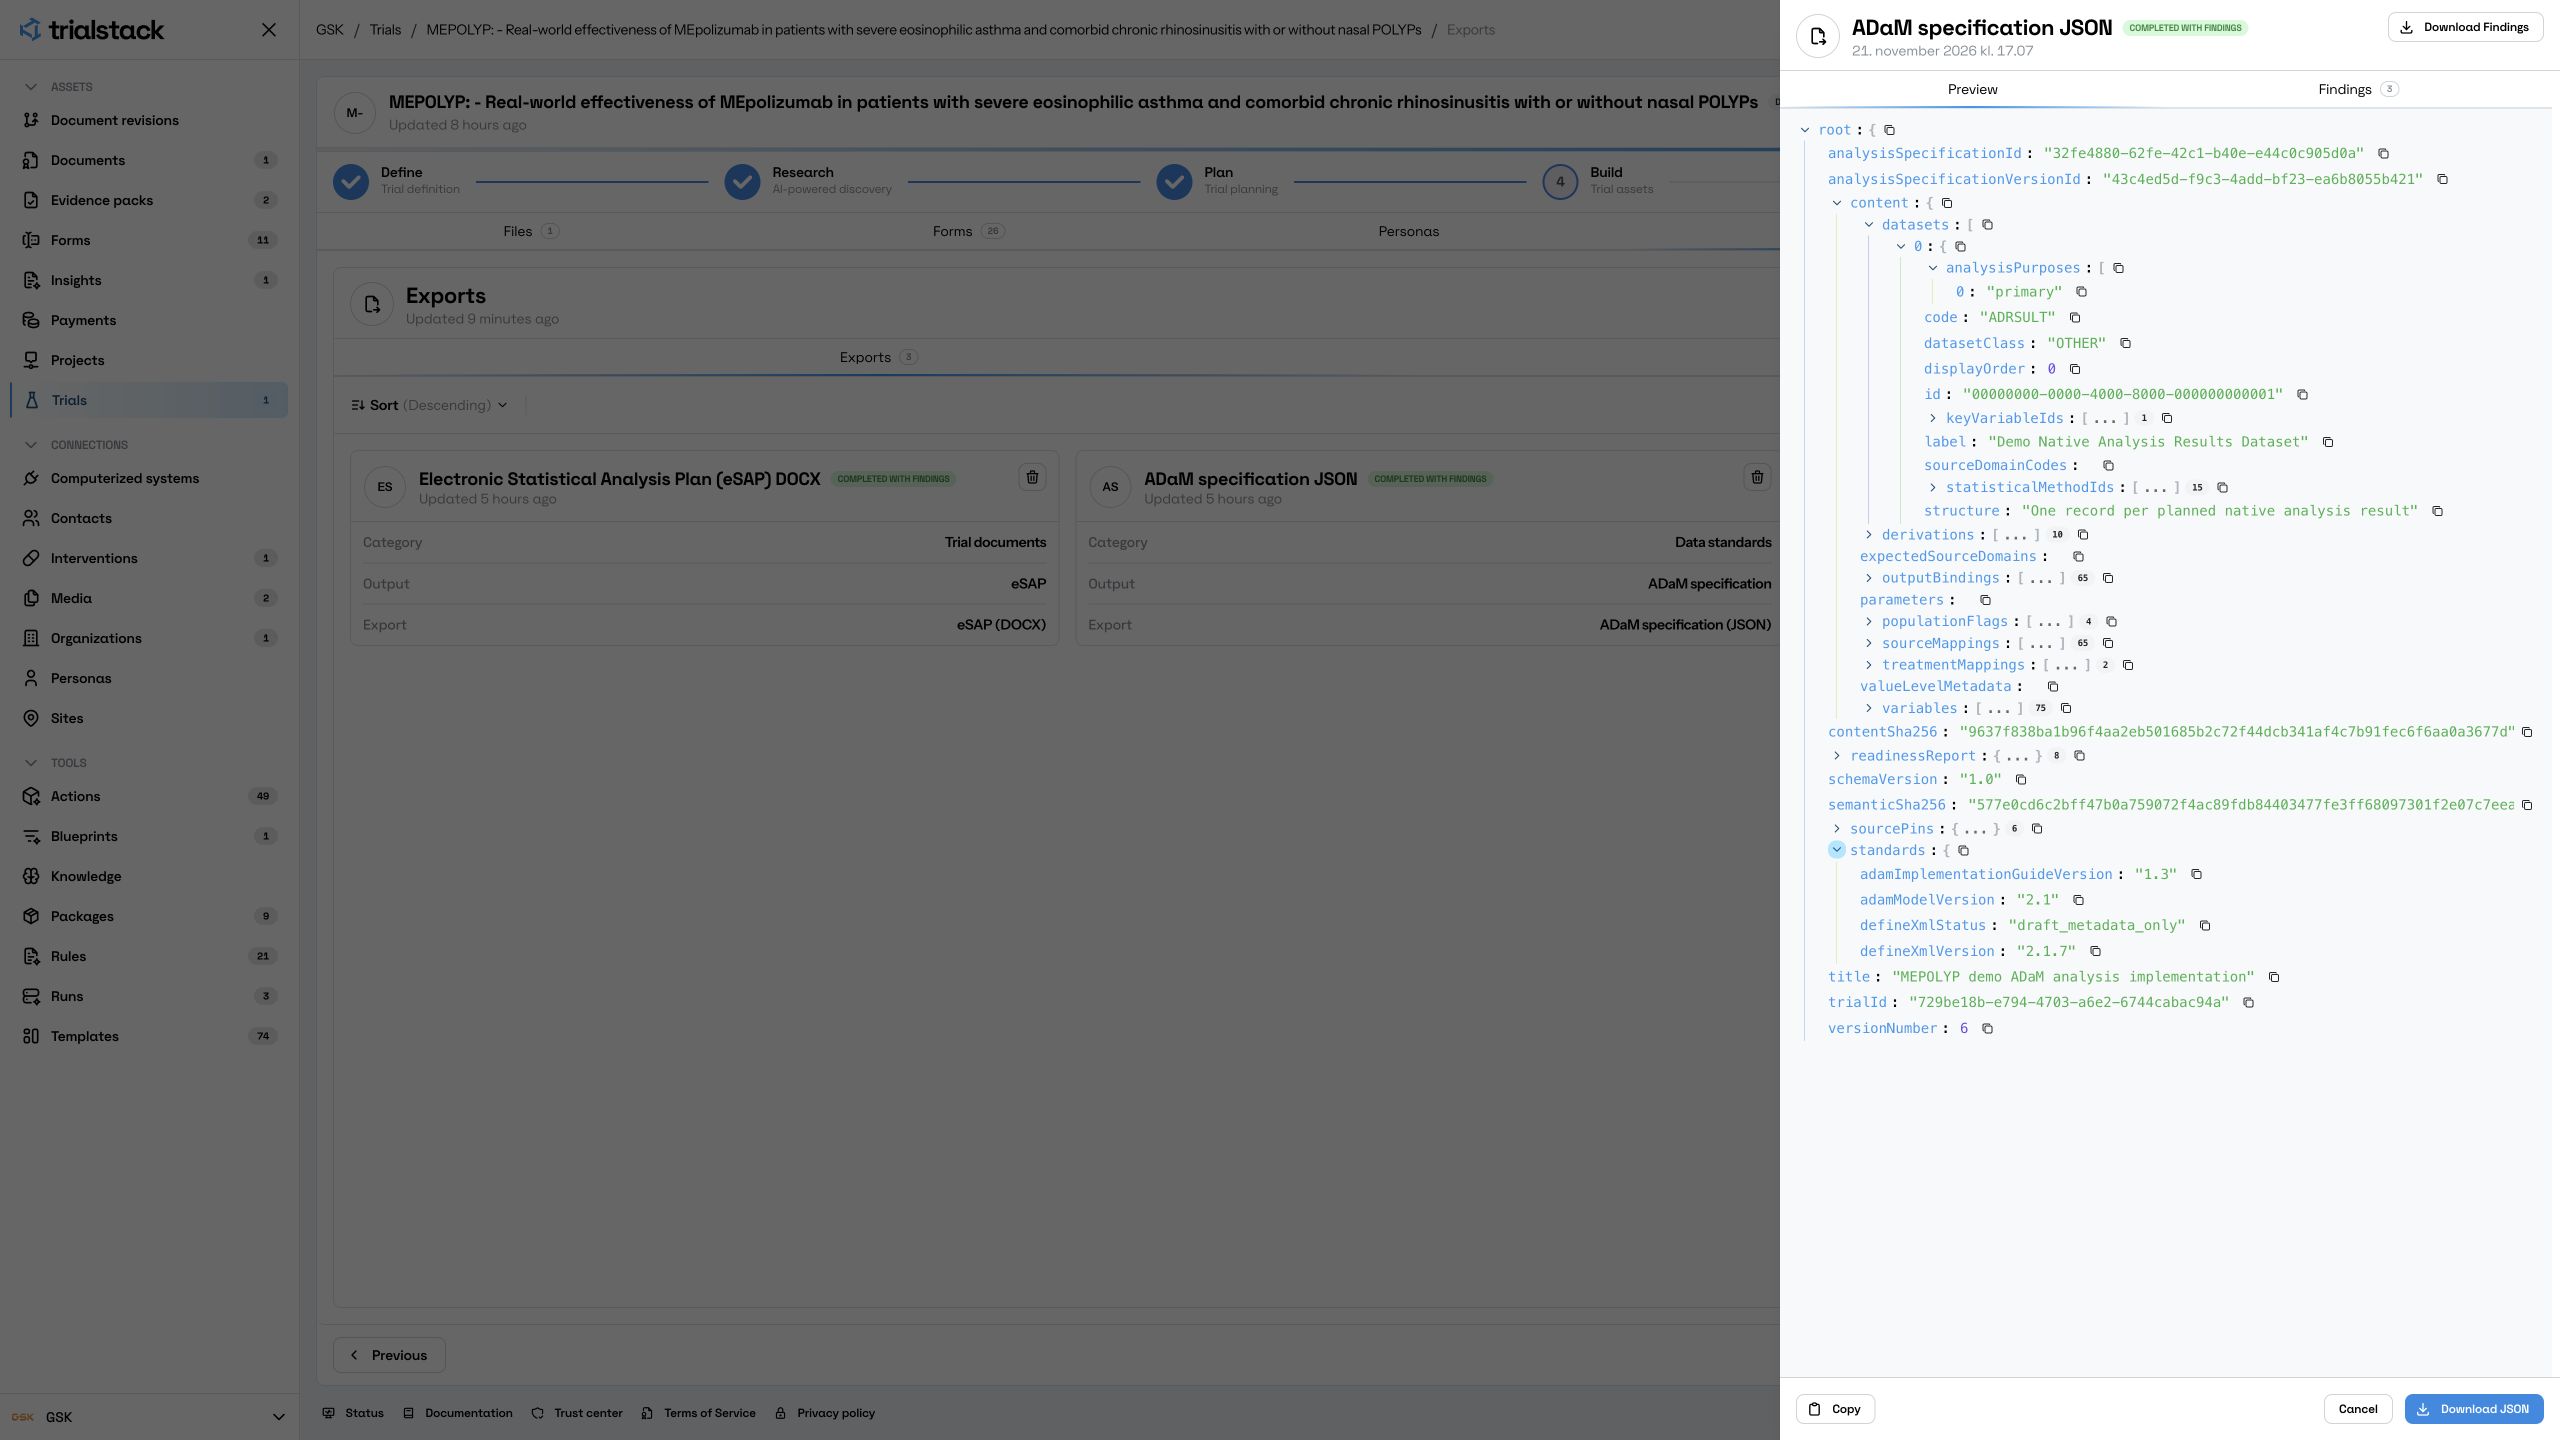
A statistician or data partner needs to know which definitions were used and what still needs review. TrialStack exports the electronic SAP, the SDTM Trial Design package and the ADaM specification. For this rehearsal, those requests took about 16 sec, 12 sec and 12 sec, respectively, including the queue.
The design package describes how the trial is set up. The ADaM specification describes how to organise the analysis data and results. Reviewers can see any findings that remain after a file is ready to download. The carousel shows the generated SAP draft for this demo. The public SAP above describes the original methods.
5. Rehearse the analysis before real data arrives
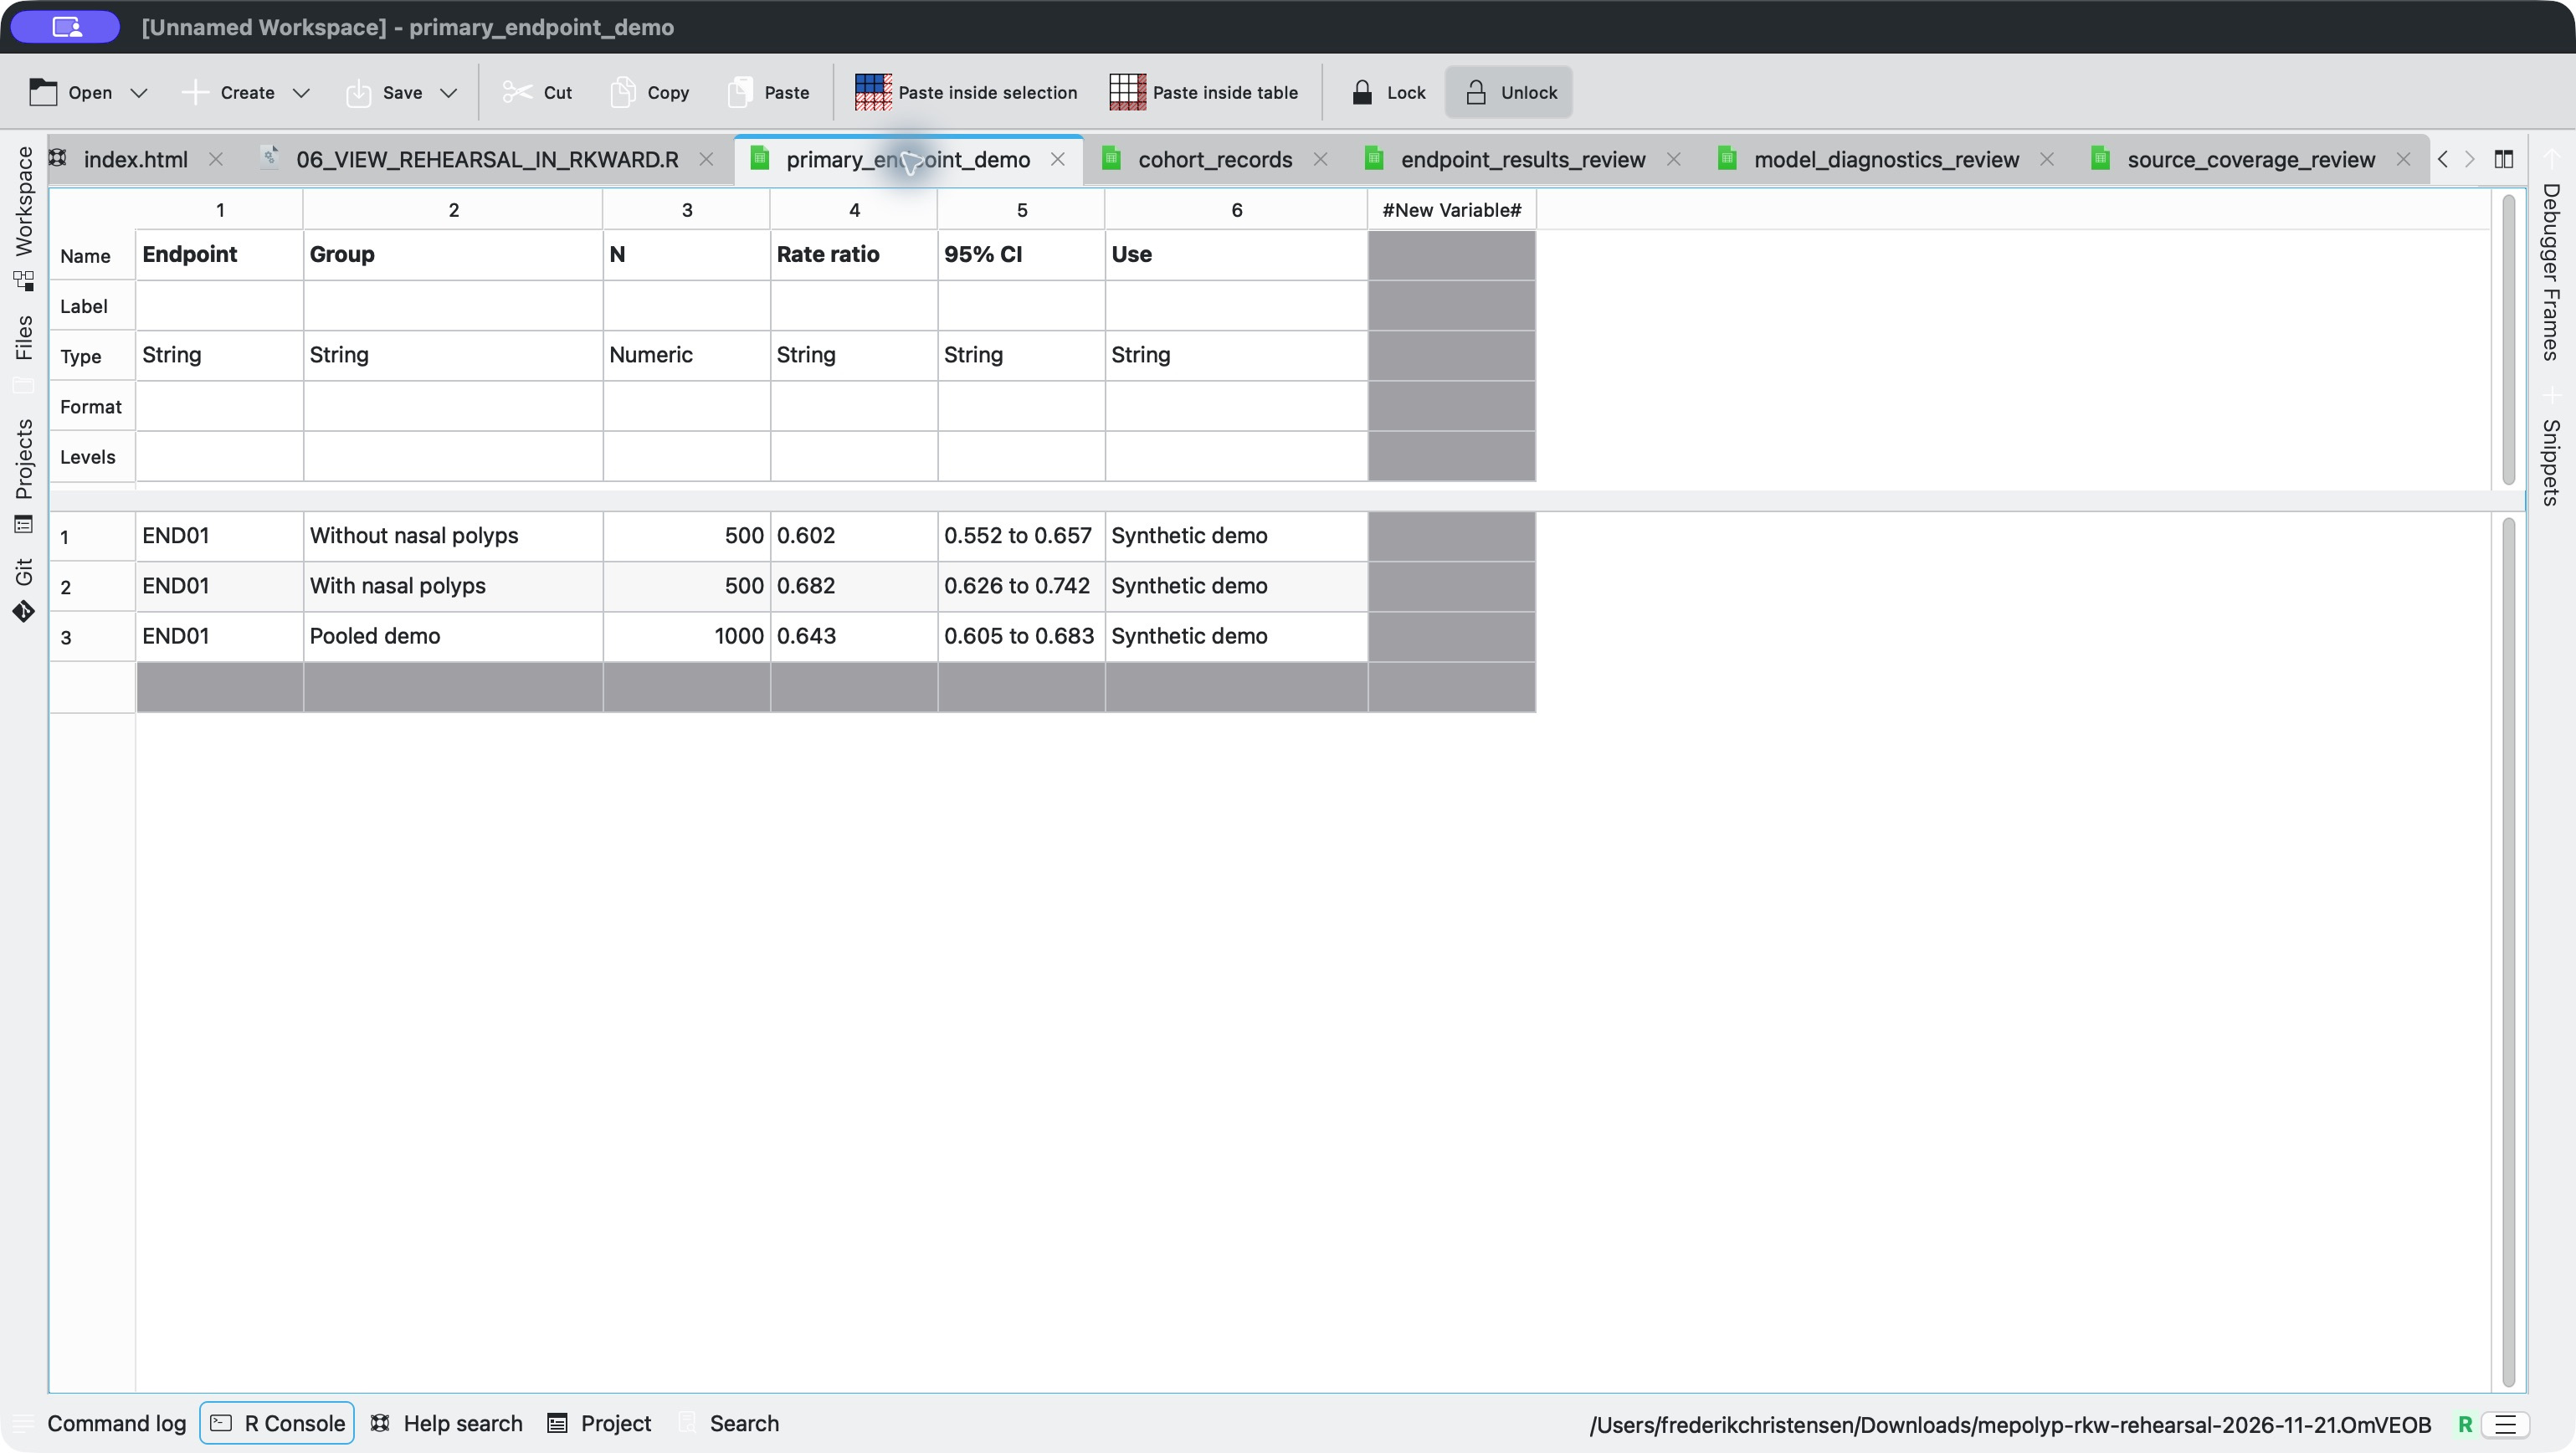
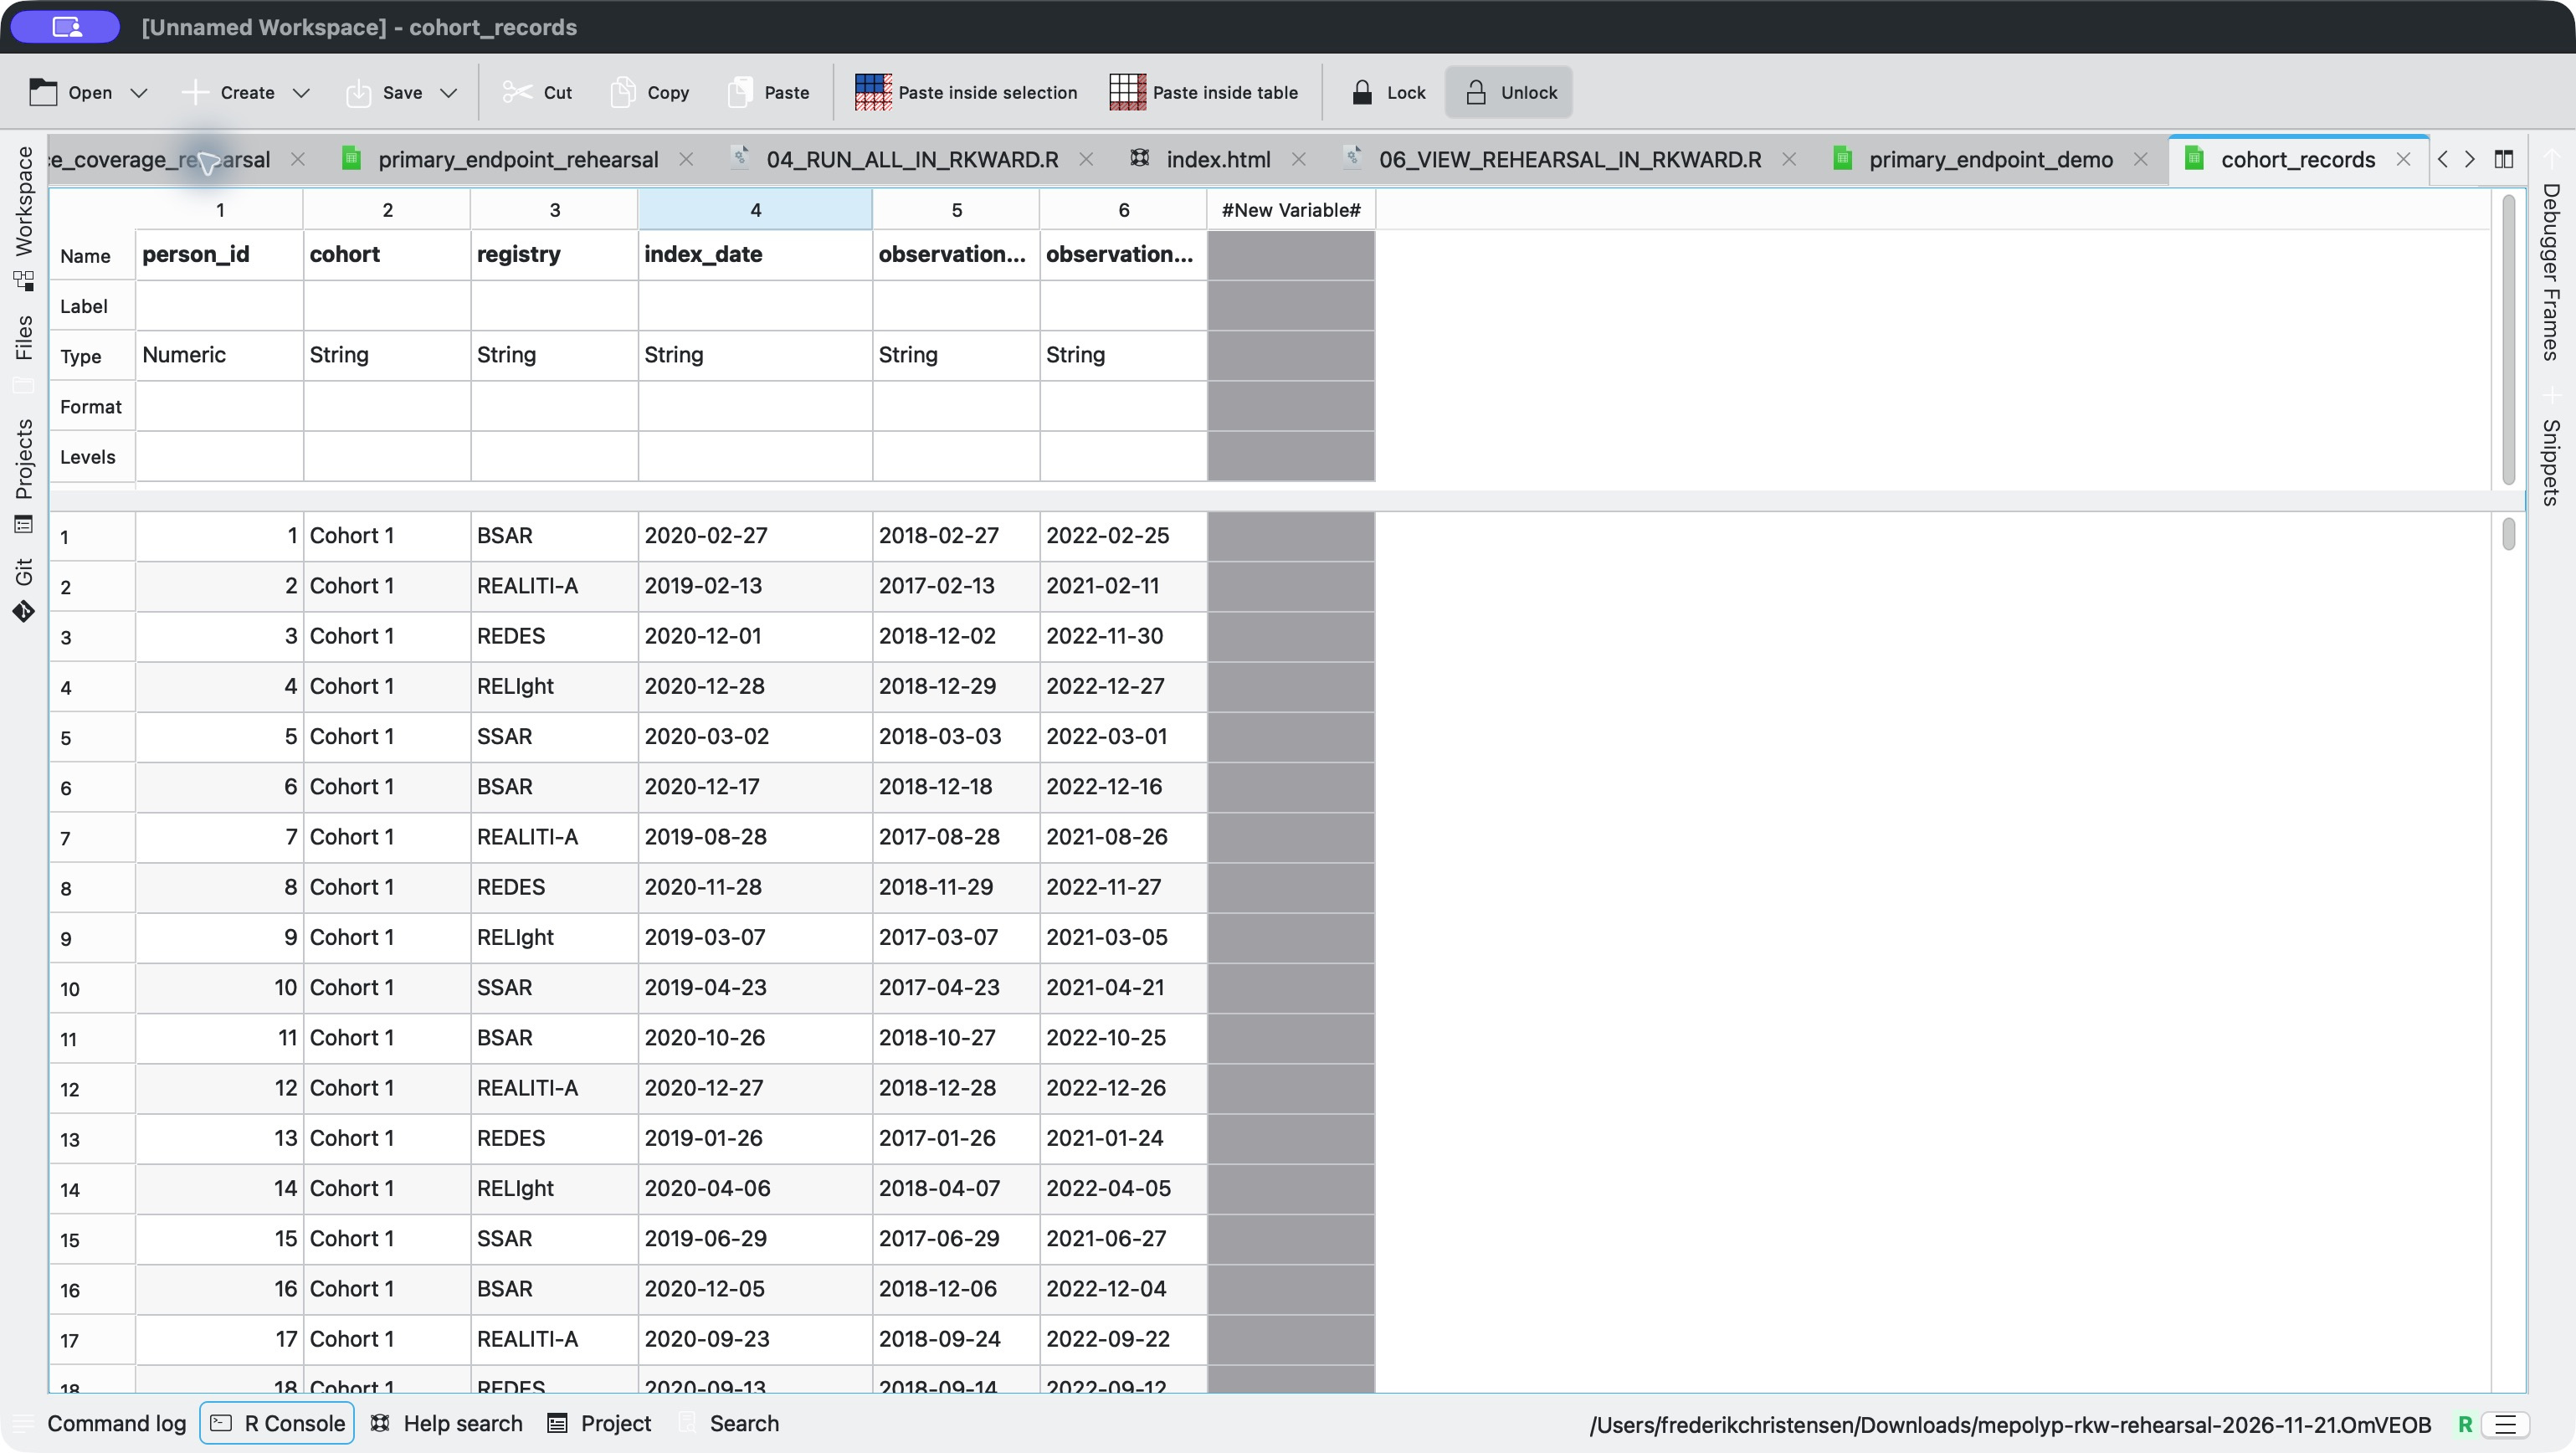
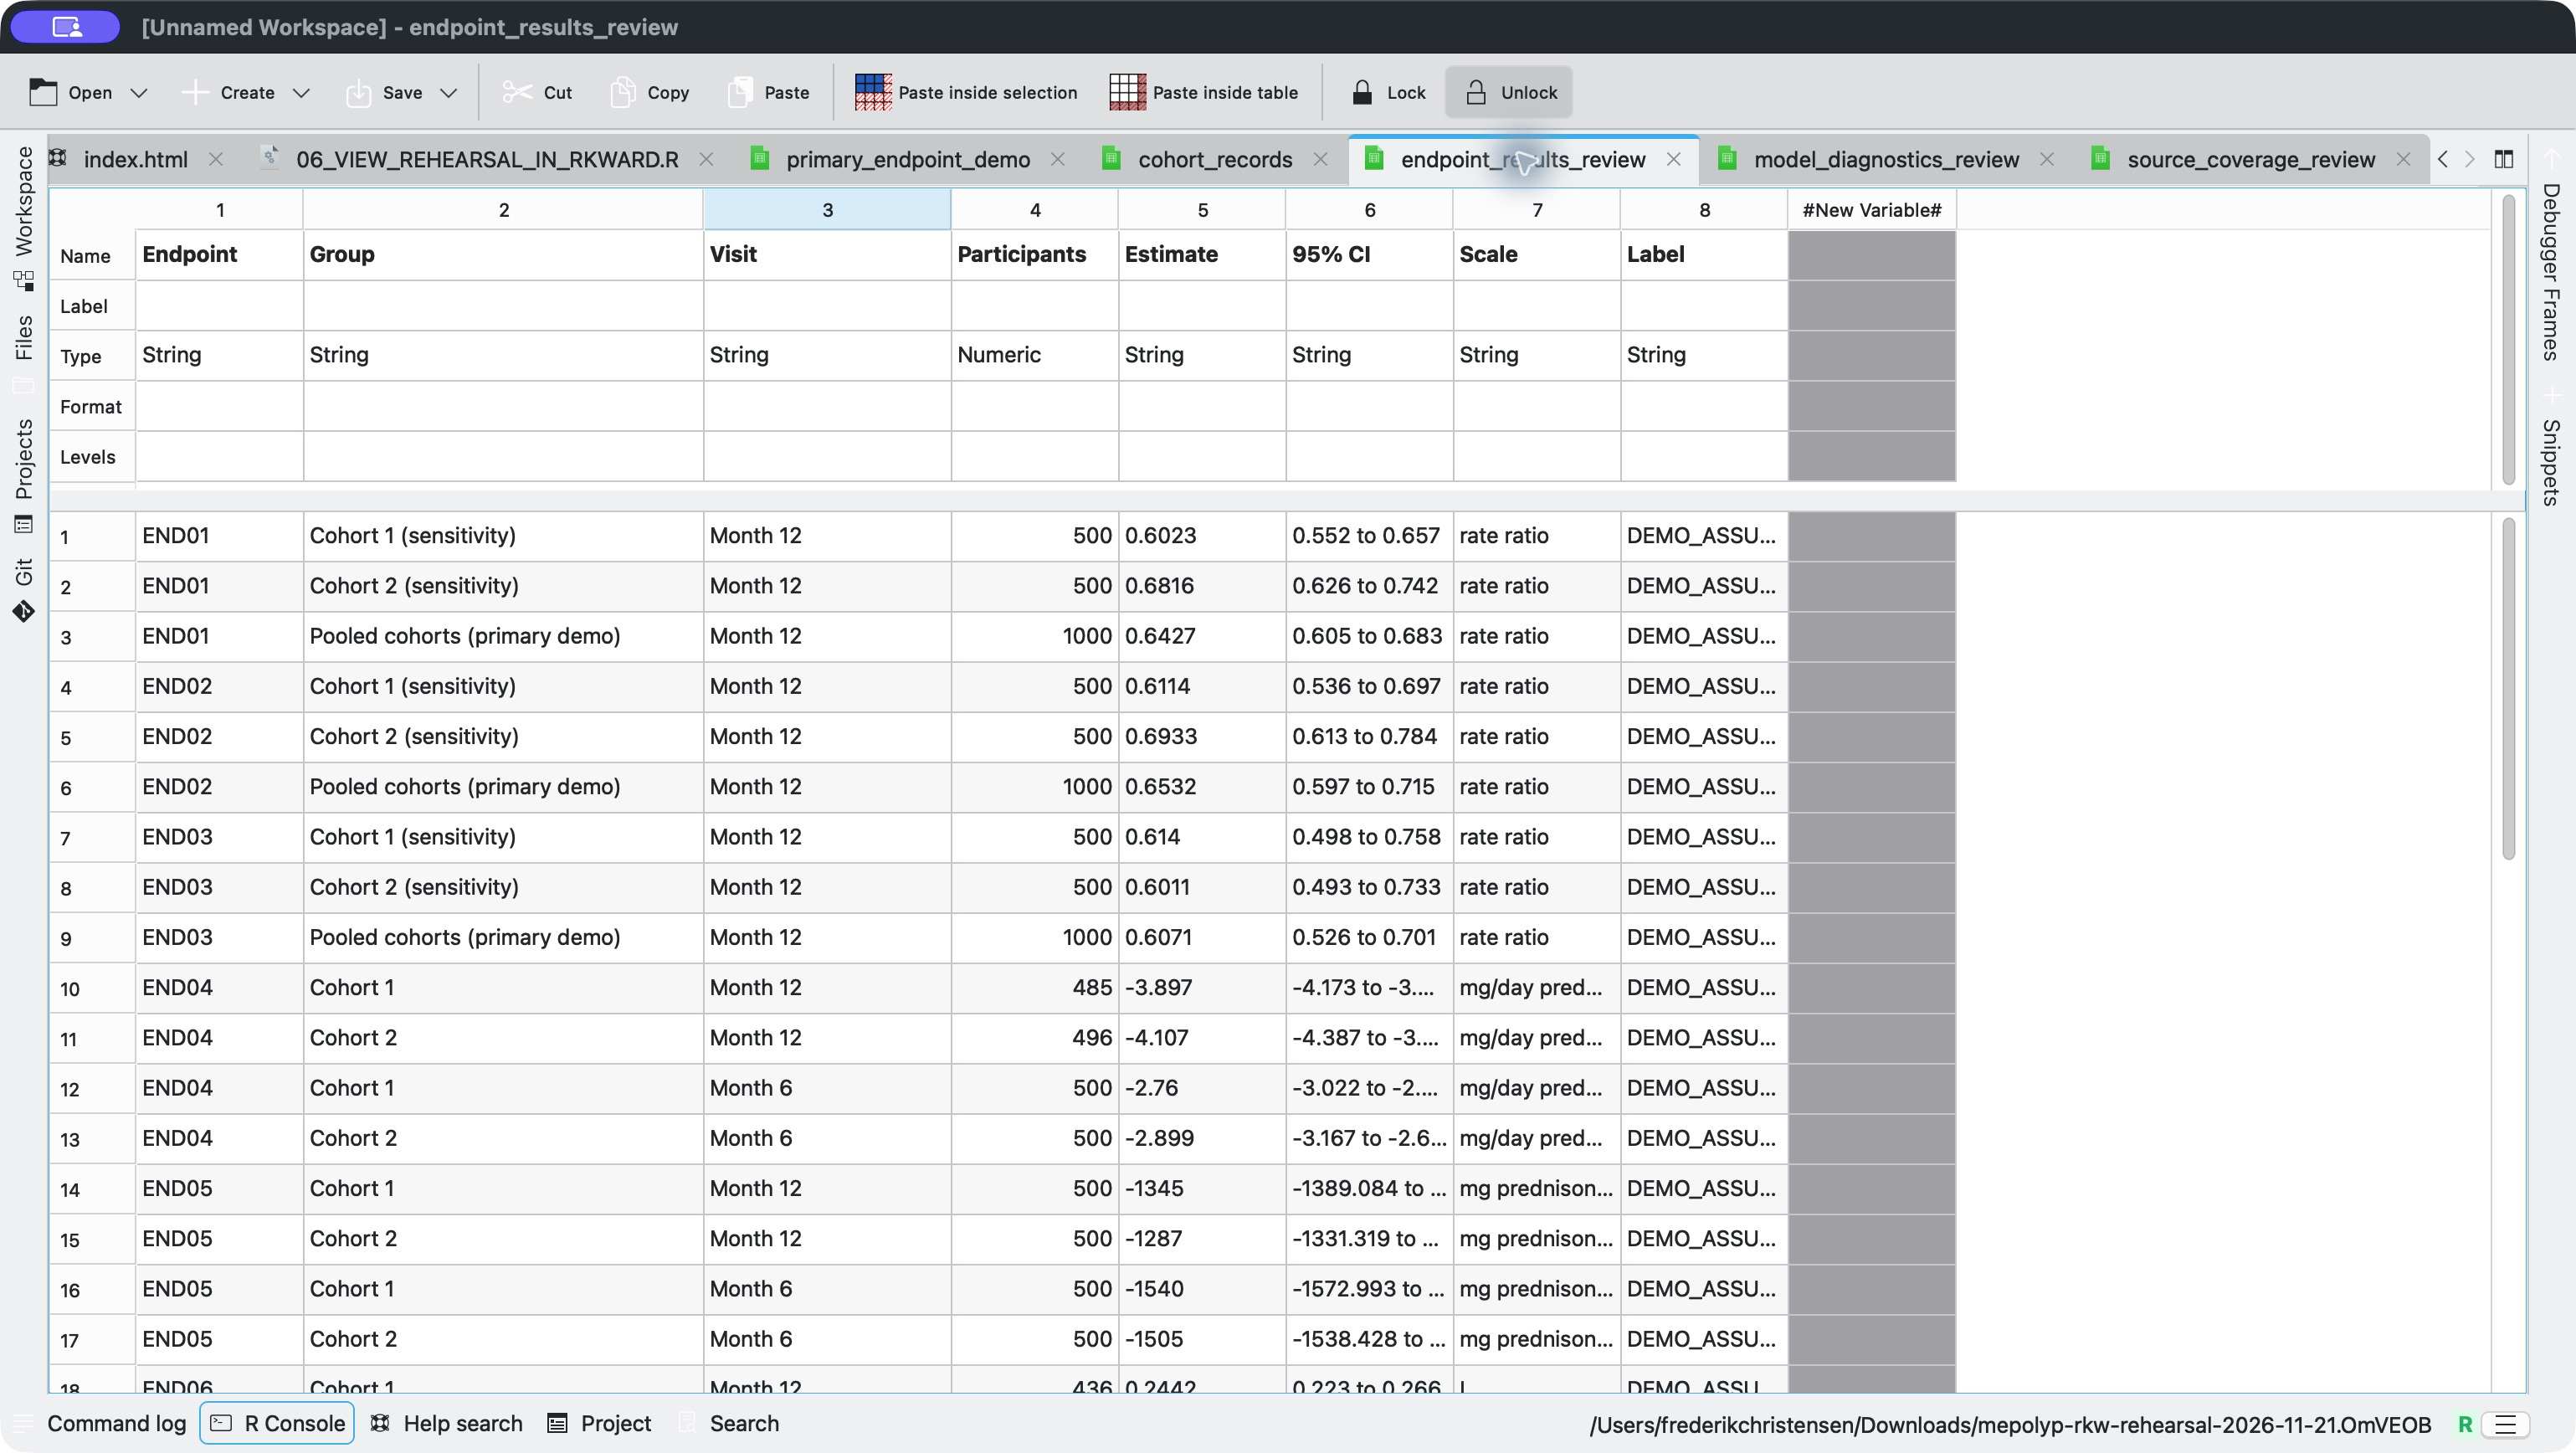
We ran the workflow in RKWard with data for 1,000 simulated participants. It produced 42 result rows across 15 demo endpoints. The analysis took 11.6 sec and generating the Word and PDF report took 4.9 sec. The demo plan called for adaptive Gaussian quadrature to fit the mixed model. The R run used a Laplace approximation.
For both simulated groups combined, the model estimated that the rate after the first prescription was about 64% of the earlier rate. The rate ratio was 0.643, with a 95% confidence interval of 0.605 to 0.683. In the chart, each dot compares the rate after the first prescription with the rate before it. The horizontal bars show the 95% confidence intervals. The dashed line at 1 marks equal rates. The rehearsal lets reviewers see what went into the result before working with real patient data.
What this demonstration establishes
The same clinical question can guide what you ask a data partner for, what you put in the analysis plan and what you check in a rehearsal. CDISC’s USDM 4.0 gives teams a common way to describe observational trials. A PHUSE example shows how teams can track real-world data from source selection through to SDTM.
Start with the sources you have and invest where better evidence could change a decision. When the team records what each source covers and why it chose each definition, the next team can see how the answer was built. They can reuse that work when the question or the source changes.